30 April 2012
High Tax Rates and Real Per Capita GDP
Peter Diamond, Professor Emeritus at MIT, and Emmanuel Saez, Professor of Economics at UC Berkeley, recently published an opinion in the Wall Street Journal on 23 April that serves to back up the call of the Democratic Socialist Party for increased tax rates on the rich. They claim that high tax rates will not slow growth. Let us examine some of their claims.
They note that when the top tax rates in the U.S. were high, 70% and above, from 1950 to 1980, the growth of GDP averaged 2.23% a year. Between 1980 and 2010, GDP growth averaged only 1.68% a year, though the highest tax bracket rates were relatively low. To evaluate the implications of these facts for the effect of a high tax rate, we need to ask if this is a controlled experiment with the highest tax rates the only important variable.
The answer is no. In 1950, most of the world owed the U.S. huge amounts of money due to WWII. Western Europe, Japan, and China were trying to rebuild following their devastation in WWII. American exports and our investments overseas were making Americans tons of money, especially given that we were ourselves finally leaping forward from a base that had been much lowered by the Great Depression. American men had returned from the war eager to make a better life than they had known in the Great Depression and the war. Americans were healthier, better fed, and better housed than any other major nation's people in the world. What is more, while Eisenhower did not drop the top tax brackets while trying to pay down the WWII debt, he did stop much of the socialist interference with the economy that had come to dominate it under FDR and Truman. In comparison, the United Kingdom and France had turned heavily to socialist policies that retarded their economic growth. Germany perhaps less so, but Germany had been especially destroyed, divided, and was hurt by British and French takings as reparations. Germany and the United Kingdom had also lost much of a generation of men.
By 1980, the many nations so damaged by WWII as Germany, Japan, and the UK had been, had managed to become more capable of competing in the world economy with the U.S., simply because they had largely rebuilt. In some cases, because of the massive rebuilding, their plant and equipment were actually newer than that of many companies in the U.S. A new generation of workers was also now at a productively mature age in these countries, as well. The playing field was once again more even. So, how did the competition compare based on the respective upper tax bracket rates in these countries?
Diamond and Saez choose to make the comparison from 1970 to 2010, instead of from 1980 to 2010, despite having noted already that the high tax rates in the U.S. were not lowered until after Reagan became President in 1981. Actually, the lowering was a couple years later than that, but it sure was not near 1970. The same was approximately true in the United Kingdom, since Margaret Thatcher took over in 1979 and soon after lowered the British highest tax rates. The 1970s in the U.S. were also a mess because of Nixon's Price Freeze and the policies of Jimmy Carter and the Federal Reserve that led to investment killing high inflation rates. Before Thatcher, Great Britain was the socialist Sick Man of Europe, with many nationalized industries and rampant labor unions.
So, Diamond and Saez point out that from 1970 to 2010, real GDP in the U.S. increased at an average rate of 1.80% a year and it increased a bit faster in the previously lethargic U.K. at 2.03% a year. In comparison, the high tax rate in France yielded an average growth rate of 1.72% a year and in Germany a rate of 1.89% a year. Not much difference. Of course, they fail to point out the other extraneous factors than high tax brackets that wipe out most of any advantage that lower tax rates might have had in part of their extended period. Throwing in the lost decade of the 1970s in the U.S. and the U.K. hides the effect of each country's lowered upper tax brackets later. This is really of the nature of a dirty trick. It is partisan politics on the part of Diamond and Saez.
James Pethokoukis has discussed this much more meaningful comparison of real GDP growth from 1981 to 2010. Examine the graph of real GDP per capita for each nation below:
During the 1982 recession, the real per capita GDP in the U.S. was about $4,000 dollars greater than that in France and Germany. It was about $7,000 more than that in the U.K. In 2010, the U.K. had surpassed France. From 2002 to 2008, the U.K. had been equal to Germany in per capita real GDP, but did fall back as the result of the financial failures that hit the larger financial industry in the U.K. compared to that in Germany. The U.K. had also tried too much stimulus spending, as had the U.S. in response to the Great Socialist Recession of 2008-2012. It seems likely on the basis of this much more valid comparison that the lower upper tax rates of the U.S. and the U.K. did have a salutary effect on real per capita GDP. Indeed, Pethokoukis offers comparisons of the U.S., Australia, Canada, Britain, France, Germany, Italy, and Switzerland. Those countries with high upper tax brackets compared to the U.S. and the U.K. fell back in per capita GDP. In both the U.S. and the U.K. there was also a relative decrease in regulations and an increase in privatization, so some other effects are also contributing.
Diamond and Saez also make claims that tax revenues do not take a hit unless the top tax rate is greater than the 50 to 70% range. They believe that a man will work just as hard when 50 to 70% of his time is taken from him as he will when 35% of his time is stolen. So they advocate a hike in the highest tax brackets and also in capital gains and dividend tax rates. When GE employs 1600 professional workers to evade taxes set at a rate of 35%, one has to wonder how Diamond and Saez can convince themselves of such nonsense. It may be that people work almost as many hours under high tax rates, but it is clear that many of the hours they work are then devoted to avoiding those high tax rates! They believe the government can and will invest the money of the rich better than the rich would.
They make assertions that some public investments such as education, infrastructure, and research have high rates of return. Yet, in fact there is no correlation of added education expenditures, either at the federal or the local levels, with knowledge in our children in the government-run school systems. Infrastructure may be necessary, but it is common for infrastructure spending to have very long payback times, such as 50 years in many cases. This is not a high rate of return. Government research is a mixed bag. Much of it is a waste and some is good. The nearly $100 billion spent on climate research in the last couple of decades has very little to show for itself. Research money spent by industry has a much better track record. Before claiming that government spending constitutes a wise investment, we need to ask how wisely the private sector would have spent the same money.
I suppose we will always have to expect that Progressive Elitists will back the idea that government spends money wisely, but not many Americans really agree with that. Admittedly, there seem to be many Americans who think government wastes their money, but would not be wasting the money of the wealthy. I am sure they are not thinking that government actually invests the money of the wealthy better. They are only thinking that they do not much care whether the government invests someone else' money well or not as long as they get a freebee or two out of it. That is the unbecoming thinking of a freeloader.
They note that when the top tax rates in the U.S. were high, 70% and above, from 1950 to 1980, the growth of GDP averaged 2.23% a year. Between 1980 and 2010, GDP growth averaged only 1.68% a year, though the highest tax bracket rates were relatively low. To evaluate the implications of these facts for the effect of a high tax rate, we need to ask if this is a controlled experiment with the highest tax rates the only important variable.
The answer is no. In 1950, most of the world owed the U.S. huge amounts of money due to WWII. Western Europe, Japan, and China were trying to rebuild following their devastation in WWII. American exports and our investments overseas were making Americans tons of money, especially given that we were ourselves finally leaping forward from a base that had been much lowered by the Great Depression. American men had returned from the war eager to make a better life than they had known in the Great Depression and the war. Americans were healthier, better fed, and better housed than any other major nation's people in the world. What is more, while Eisenhower did not drop the top tax brackets while trying to pay down the WWII debt, he did stop much of the socialist interference with the economy that had come to dominate it under FDR and Truman. In comparison, the United Kingdom and France had turned heavily to socialist policies that retarded their economic growth. Germany perhaps less so, but Germany had been especially destroyed, divided, and was hurt by British and French takings as reparations. Germany and the United Kingdom had also lost much of a generation of men.
By 1980, the many nations so damaged by WWII as Germany, Japan, and the UK had been, had managed to become more capable of competing in the world economy with the U.S., simply because they had largely rebuilt. In some cases, because of the massive rebuilding, their plant and equipment were actually newer than that of many companies in the U.S. A new generation of workers was also now at a productively mature age in these countries, as well. The playing field was once again more even. So, how did the competition compare based on the respective upper tax bracket rates in these countries?
Diamond and Saez choose to make the comparison from 1970 to 2010, instead of from 1980 to 2010, despite having noted already that the high tax rates in the U.S. were not lowered until after Reagan became President in 1981. Actually, the lowering was a couple years later than that, but it sure was not near 1970. The same was approximately true in the United Kingdom, since Margaret Thatcher took over in 1979 and soon after lowered the British highest tax rates. The 1970s in the U.S. were also a mess because of Nixon's Price Freeze and the policies of Jimmy Carter and the Federal Reserve that led to investment killing high inflation rates. Before Thatcher, Great Britain was the socialist Sick Man of Europe, with many nationalized industries and rampant labor unions.
So, Diamond and Saez point out that from 1970 to 2010, real GDP in the U.S. increased at an average rate of 1.80% a year and it increased a bit faster in the previously lethargic U.K. at 2.03% a year. In comparison, the high tax rate in France yielded an average growth rate of 1.72% a year and in Germany a rate of 1.89% a year. Not much difference. Of course, they fail to point out the other extraneous factors than high tax brackets that wipe out most of any advantage that lower tax rates might have had in part of their extended period. Throwing in the lost decade of the 1970s in the U.S. and the U.K. hides the effect of each country's lowered upper tax brackets later. This is really of the nature of a dirty trick. It is partisan politics on the part of Diamond and Saez.
James Pethokoukis has discussed this much more meaningful comparison of real GDP growth from 1981 to 2010. Examine the graph of real GDP per capita for each nation below:
During the 1982 recession, the real per capita GDP in the U.S. was about $4,000 dollars greater than that in France and Germany. It was about $7,000 more than that in the U.K. In 2010, the U.K. had surpassed France. From 2002 to 2008, the U.K. had been equal to Germany in per capita real GDP, but did fall back as the result of the financial failures that hit the larger financial industry in the U.K. compared to that in Germany. The U.K. had also tried too much stimulus spending, as had the U.S. in response to the Great Socialist Recession of 2008-2012. It seems likely on the basis of this much more valid comparison that the lower upper tax rates of the U.S. and the U.K. did have a salutary effect on real per capita GDP. Indeed, Pethokoukis offers comparisons of the U.S., Australia, Canada, Britain, France, Germany, Italy, and Switzerland. Those countries with high upper tax brackets compared to the U.S. and the U.K. fell back in per capita GDP. In both the U.S. and the U.K. there was also a relative decrease in regulations and an increase in privatization, so some other effects are also contributing.
Diamond and Saez also make claims that tax revenues do not take a hit unless the top tax rate is greater than the 50 to 70% range. They believe that a man will work just as hard when 50 to 70% of his time is taken from him as he will when 35% of his time is stolen. So they advocate a hike in the highest tax brackets and also in capital gains and dividend tax rates. When GE employs 1600 professional workers to evade taxes set at a rate of 35%, one has to wonder how Diamond and Saez can convince themselves of such nonsense. It may be that people work almost as many hours under high tax rates, but it is clear that many of the hours they work are then devoted to avoiding those high tax rates! They believe the government can and will invest the money of the rich better than the rich would.
They make assertions that some public investments such as education, infrastructure, and research have high rates of return. Yet, in fact there is no correlation of added education expenditures, either at the federal or the local levels, with knowledge in our children in the government-run school systems. Infrastructure may be necessary, but it is common for infrastructure spending to have very long payback times, such as 50 years in many cases. This is not a high rate of return. Government research is a mixed bag. Much of it is a waste and some is good. The nearly $100 billion spent on climate research in the last couple of decades has very little to show for itself. Research money spent by industry has a much better track record. Before claiming that government spending constitutes a wise investment, we need to ask how wisely the private sector would have spent the same money.
I suppose we will always have to expect that Progressive Elitists will back the idea that government spends money wisely, but not many Americans really agree with that. Admittedly, there seem to be many Americans who think government wastes their money, but would not be wasting the money of the wealthy. I am sure they are not thinking that government actually invests the money of the wealthy better. They are only thinking that they do not much care whether the government invests someone else' money well or not as long as they get a freebee or two out of it. That is the unbecoming thinking of a freeloader.
23 April 2012
Democracy Fails, Americans Too Politically Ignorant
A Pew Research Center poll conducted from 29 March to 1 April 2012 found that the knowledge of Americans about the Republican and Democratic Parties was abysmal. Overall, on the following issues of party policies or preferences, in which the correct answer is given in parentheses, it was found that:
To clarify one of the questions, the Democrats are more likely to favor a path to citizenship for illegal aliens.
Overall, Americans rate a C- on identifying the more conservative party, a D on recognizing the Democrats as being more in favor of raising taxes on the rich, of expanding freedoms and privileges for gay people, and in favor of providing citizenship to illegal aliens. They earned a D- on recognizing the Republicans as being more in favor of abortion restrictions and of oil drilling in the Arctic Refuge. They earned an F in recognizing the Democrats as more in favor of defense spending cuts and the Republicans as generally more in favor of reducing the size and scope of government. It is very clear that when Americans vote in an election for one party or another or for a candidate from one party or another, they have a very inadequate knowledge of what they are doing.
The poll also asked Americans if they could identify the party each of the following politicians is or was associated with: Nancy Pelosi, Franklin Roosevelt, Abraham Lincoln, Ronald Reagan, Bill Clinton, John F. Kennedy, and John Boehner. They also asked which party was represented by a donkey and which was indicated by GOP. There were a total of 17 questions. Republicans answered a woeful 12.6 correctly (74%, grade of C), but Democrats answered even more woefully with only 11.4 correct answers (67%, grade of D). Independents are apparently independent of the parties because they have so little knowledge that they cannot even choose a party. They were correct only 10.7 times out of 17 (63%, grade of D).
One might argue that there are some inadequacies in the questions, but anyone reasonably knowledgeable about the political issues and who stands for what, would know all of these answers. It is interesting that Republicans were less inclined to identify themselves as wanting to restrict access to abortions than the Democrats were. They were also less likely to identify the Democrats as wanting citizenship for illegal aliens and reducing military spending than were the Democrats. The only politician the Democrats could better identify with a party than could Republicans was John Boehner, the Republican Speaker of the House! Republicans were much better at identifying the more historical politicians, Roosevelt and Lincoln, with a party than were Democrats. This indicates a greater historical knowledge among Republicans.
One of the reasons we are given for a government-run school system is that every future citizen must have enough knowledge to vote in a democracy. Well, the poll shows that the school system has failed utterly in this. The age group from 18 - 29 was only able to answer 10.1 questions out of 17 correctly (59%, an F grade), while the next older group of 30 - 49 was able to answer 10.9 right (64%, a D). The 50 - 64 age group inched up to 11.5 correct, and those 65 and over, despite memory loss, knew 11.9. The longer one is out of government-run schools, the more one knows about politics. The one bright area for the youngest age group was knowing the answers related to what are considered the politically correct social issues. Only 43% could identify Pelosi with her party, only 43% could do the same for FDR, and only 43% could so identify Boehner. 48% knew Lincoln was a Republican. Of course a random guesser would be right 50% of the time.
There are some interesting lessons in this data for the Republican Party. Most Americans believe that the federal government is too big and too involved in their lives. This means there are many Americans who are not Republicans who believe this. Yet only 51% of the Independents identified the Republicans as the party more in favor of reducing the size and scope of the federal government. Perhaps the Republicans have assumed this was obvious and have not sufficiently publicized this policy stance. Only 46% of Democrats could identify the Republicans as generally wanting smaller government. With so many Americans unhappy with a domineering government, there are surely even some Democrats who want smaller government. We know there are some who oppose ObamaCare, for instance. Only 44% of the 18 - 29 age group saw the Republicans as the party of smaller government and the age group of 30 - 49 was a low 53% as well. This is a message the Republicans, surprisingly, need to drum home.
With political ignorance so dominant among Americans, it is hardly any wonder that our increasingly unlimited democracy coupled with unlimited government is failing so badly. The People are generally dissatisfied and believe the country is going in the wrong direction. As I have noted many times, they do not understand what is going on and they have an entirely inadequate knowledge of history, economics, and civics. They see a huge government involved in far too many activities for them to follow and be current on. They see that special interests who can make the time to be informed and to develop close political ties to the politicians have more influence over the government than they do. They understand that the government is commonly not acting in their best interest, yet they cannot even identify the party that wants a less unlimited government.
This process of ever more befuddling government has been building for over 100 years now and most of the people are simply turned off on political issues. Because of this, democracy has become hollow and useless as a value, yet it is a great danger. This is a very predictable result of big, unlimited government. The last shreds of our republic, turned meaninglessly democratic, will disintegrate unless the People come to demand that government be constitutionally limited once again. It is certain that a grade D citizenry cannot halt the inexorable pressures of a federal government determined to rule without limits. We are doomed to living under tyranny, unless the People decide to study and raise their grades. It this is to come about, it is essential that we turn to private sector education for all age groups, but especially for the young so that we will not have a grade F 18 - 29 age citizen group.
To clarify one of the questions, the Democrats are more likely to favor a path to citizenship for illegal aliens.
Overall, Americans rate a C- on identifying the more conservative party, a D on recognizing the Democrats as being more in favor of raising taxes on the rich, of expanding freedoms and privileges for gay people, and in favor of providing citizenship to illegal aliens. They earned a D- on recognizing the Republicans as being more in favor of abortion restrictions and of oil drilling in the Arctic Refuge. They earned an F in recognizing the Democrats as more in favor of defense spending cuts and the Republicans as generally more in favor of reducing the size and scope of government. It is very clear that when Americans vote in an election for one party or another or for a candidate from one party or another, they have a very inadequate knowledge of what they are doing.
The poll also asked Americans if they could identify the party each of the following politicians is or was associated with: Nancy Pelosi, Franklin Roosevelt, Abraham Lincoln, Ronald Reagan, Bill Clinton, John F. Kennedy, and John Boehner. They also asked which party was represented by a donkey and which was indicated by GOP. There were a total of 17 questions. Republicans answered a woeful 12.6 correctly (74%, grade of C), but Democrats answered even more woefully with only 11.4 correct answers (67%, grade of D). Independents are apparently independent of the parties because they have so little knowledge that they cannot even choose a party. They were correct only 10.7 times out of 17 (63%, grade of D).
One might argue that there are some inadequacies in the questions, but anyone reasonably knowledgeable about the political issues and who stands for what, would know all of these answers. It is interesting that Republicans were less inclined to identify themselves as wanting to restrict access to abortions than the Democrats were. They were also less likely to identify the Democrats as wanting citizenship for illegal aliens and reducing military spending than were the Democrats. The only politician the Democrats could better identify with a party than could Republicans was John Boehner, the Republican Speaker of the House! Republicans were much better at identifying the more historical politicians, Roosevelt and Lincoln, with a party than were Democrats. This indicates a greater historical knowledge among Republicans.
One of the reasons we are given for a government-run school system is that every future citizen must have enough knowledge to vote in a democracy. Well, the poll shows that the school system has failed utterly in this. The age group from 18 - 29 was only able to answer 10.1 questions out of 17 correctly (59%, an F grade), while the next older group of 30 - 49 was able to answer 10.9 right (64%, a D). The 50 - 64 age group inched up to 11.5 correct, and those 65 and over, despite memory loss, knew 11.9. The longer one is out of government-run schools, the more one knows about politics. The one bright area for the youngest age group was knowing the answers related to what are considered the politically correct social issues. Only 43% could identify Pelosi with her party, only 43% could do the same for FDR, and only 43% could so identify Boehner. 48% knew Lincoln was a Republican. Of course a random guesser would be right 50% of the time.
There are some interesting lessons in this data for the Republican Party. Most Americans believe that the federal government is too big and too involved in their lives. This means there are many Americans who are not Republicans who believe this. Yet only 51% of the Independents identified the Republicans as the party more in favor of reducing the size and scope of the federal government. Perhaps the Republicans have assumed this was obvious and have not sufficiently publicized this policy stance. Only 46% of Democrats could identify the Republicans as generally wanting smaller government. With so many Americans unhappy with a domineering government, there are surely even some Democrats who want smaller government. We know there are some who oppose ObamaCare, for instance. Only 44% of the 18 - 29 age group saw the Republicans as the party of smaller government and the age group of 30 - 49 was a low 53% as well. This is a message the Republicans, surprisingly, need to drum home.
With political ignorance so dominant among Americans, it is hardly any wonder that our increasingly unlimited democracy coupled with unlimited government is failing so badly. The People are generally dissatisfied and believe the country is going in the wrong direction. As I have noted many times, they do not understand what is going on and they have an entirely inadequate knowledge of history, economics, and civics. They see a huge government involved in far too many activities for them to follow and be current on. They see that special interests who can make the time to be informed and to develop close political ties to the politicians have more influence over the government than they do. They understand that the government is commonly not acting in their best interest, yet they cannot even identify the party that wants a less unlimited government.
This process of ever more befuddling government has been building for over 100 years now and most of the people are simply turned off on political issues. Because of this, democracy has become hollow and useless as a value, yet it is a great danger. This is a very predictable result of big, unlimited government. The last shreds of our republic, turned meaninglessly democratic, will disintegrate unless the People come to demand that government be constitutionally limited once again. It is certain that a grade D citizenry cannot halt the inexorable pressures of a federal government determined to rule without limits. We are doomed to living under tyranny, unless the People decide to study and raise their grades. It this is to come about, it is essential that we turn to private sector education for all age groups, but especially for the young so that we will not have a grade F 18 - 29 age citizen group.
Obama Helps One Industry Grow
Yes, there is one industry that Obama has helped to grow. Of course, given his strongly anti-business ideology, this is unexpected. How could any industry escape his effort to damage commerce and business in America? Well, it is precisely because he wants to harm this industry, but has not yet had the political power to do so, that this industry is growing quite significantly. Many fear Obama will interfere with the sales of this industry if he is re-elected. The industry in question is the gun industry. Many in that industry say Obama should be named "Gun Salesman of the Year."
Sales of guns were up from $19 billion in 2008 to $31 billion in 2011. This is a 63% increase. Jobs in the industry are up 30%. Federal taxes paid by the industry are up 66% in that 3 year period to $2.5 billion. How cool it is that an industry can actually thrive on Obama's ire!
Actually, this industry is seeing a renewal of constitutional protection of Second Amendment rights to own a firearm. While it is generally the case that Obama and other Progressive Elitists want to interfere with the individual right to own and bear arms, the Federal Courts are finally standing up for the Second Amendment.
Sales of guns were up from $19 billion in 2008 to $31 billion in 2011. This is a 63% increase. Jobs in the industry are up 30%. Federal taxes paid by the industry are up 66% in that 3 year period to $2.5 billion. How cool it is that an industry can actually thrive on Obama's ire!
Actually, this industry is seeing a renewal of constitutional protection of Second Amendment rights to own a firearm. While it is generally the case that Obama and other Progressive Elitists want to interfere with the individual right to own and bear arms, the Federal Courts are finally standing up for the Second Amendment.
22 April 2012
Updating Obama's Failed Green Energy Company Subsidy Program
Back on 6 March 2012, I discussed the topic Government Directed Green Energy Spending Hurts Economy. I can add a few failed green energy companies funded with grants and loans and/or whose energy use was mandated by the Obama government to the list I provided then. Some companies that had been reported to be bankrupt had not actually gone bankrupt, so I have made some corrections on that issue. I have added some further information about government loans, grants, tax credits, and subsidies. It has been noted that the owners of these companies are most commonly major campaign contributors to Obama and that the practice of company executives receiving bonuses or pay increases shortly before the companies go bankrupt is distressingly common. Examples of the bonus/pay increases include Solyndra Solar, Beacon Power, A123 Systems, and Ener1.
In numerous cases, government funding has disappeared in a whirlpool of company bankruptcies and very poor investment results. Among the problem companies are:
Solar:
In numerous cases, government funding has disappeared in a whirlpool of company bankruptcies and very poor investment results. Among the problem companies are:
Solar:
- Solyndra Solar, $535 million DOE loan, bankrupt
- Evergreen Solar, $5.3 million loan, bankrupt
- Spectra Watt, bankrupt
- Energy Conversion Devices and United Solar Ovonic or UniSolar, bankrupt
- Amonix, laid off employees, losing money, stock held by Warren Buffet
- SunPower, stock price has fallen greatly
- Abound Solar, laid off nearly half of employees, Fitch rated highly speculative investment, DOE loaned it $400 million
- NRG Energy, solar, wind, electric vehicle, stock price less than half of 2008 price, $1.2 billion DOE loan.
- First Solar, stock price less than 10% of 2008 high, fallen badly since early 2011, DOE loans of $5.35 billion, cutting 2,000 workers, closing plant near Berlin, Germany, lost $39.5 million in 2011, Germany and Italy cut subsidies for major on-grid utility scale solar installations.
- Bright Source, withdrew IPO
- Mountain Plaza Inc., truck stop electrification, bankrupt, $10 million loan from state of Wisconsin under Recovery Act
- A123 Systems, batteries, $300 million from Recovery Act, $135 million from state of CA, verge of bankruptcy
- EnerDel and Ener1, Lithium ion batteries, $118.5 million of DOE grant, bankrupt
- Beacon Power, energy storage, $43 million DOE loan, bankrupt
- Fisker Automotive, electric vehicles, made only 40 cars two years late in Finland, only 40 mile range, $7500 tax credit with vehicle purchase
- Tesla Motors, electric vehicles, DOE loans of $465 million, $7500 tax credit with car purchase
- GM Chevy Volt, suspended production, layoffs, failure to meet production goals, $7500 tax credit with purchase
- Bright Automotive, hybrid fleet trucks, bankrupt, claimed DOE told them they were close to winning $450 million loan for 3 years, counted on Obama pledge to have 1 million electric vehicles on the road by 2015
- Nevada Geothermal Power, Harry Reid favorite, $98.5 million DOE loan, $66 million in grants, struggling, auditor says “significant doubt about the company’s ability to continue as a going concern.”
- Olsen's Crop Service and Olsen's Mills Acquisition Co. (bankrupt, $10 million loan)
21 April 2012
Pelosi Wants Constitutional Amendment to Deprive Persons of Freedom of Speech
The ex-Speaker of the House of Representatives when it was controlled by the Democrat Socialist Party prior to the 2010 election, wants to deprive some people who are associated with one another in a certain way of their freedom of speech. The association she wishes to use as a means of muzzling speech takes the form of a corporation. She and many other Progressive Elitists were incensed when the Supreme Court ruled against such a deprivation of freedom of speech in the Bipartisan Campaign Reform Act (BCRA) of 2002, often called the McCain-Feingold Act. The case was called Citizens United v. FEC, which I earlier discussed here.
There is a completely irrelevant claim that a corporation is not a person, therefore it can be muzzled. This ignores the very obvious fact that individuals actually do the speaking. It ignores the fact that the speaker has voluntarily chosen an association with a set of other individuals in order to pursue values and goals of his own choosing in the private sector. The particular association is a legal entity which offers some protections of the assets of the individuals who own and manage the legal entity. The mere fact that they seek these legal protections should not deprive them of the right to speak freely.
It is important to be aware of the fact that the corporation form of association may apply to a giant or a micro business. It may apply to a think tank or to a charitable organization. The association of people pursuing common goals in the private sector as a corporation does not imply that these goals are either moral or immoral, and it does not imply that government has any legitimate purpose in promoting or thwarting the goals of the individuals using their freedom of association in the private sector to cooperate closely with others in the association organization called a corporation.
Because government all too often tries to interfere with the rights of individuals in voluntary associations in the private sector, the organization of individuals may have a very dire need to protect their common interests from the government. This means that there are very important joint efforts the associated individuals will want to take to influence the outcome of an election. They have as much right to do so as members of a bridge club or book club do. They have as much right as those in a business organized as a LLC or a LLLLP. They have as much right as those in a business organized as a partnership. They have as much a right to freedom of speech as do members of a church or of a family. As the Supreme Court very wisely pointed out, the fact that an individual has exercised his freedom of association should not deprive him of his freedom of speech. There is no case in which the exercise of one freedom should deprive us of our other freedoms.
Some people want to deprive the persons involved in a corporation's activities of their freedom of speech because they see some corporations as very powerful. They fear that this power will badly influence government policies. Of course, they ignore the fact that if the government were as limited in power as is mandated by the Constitution, then there would be little reason for the people in a corporation to fear the government and little reason for them to make the effort to try to control or influence the policies of the government. Any problems that do result from big corporations using their money to influence elections are the result of excessive and illegitimate government.
Of course, Nancy Pelosi is an advocate of unlimited government. She is most eager to deprive people associated in corporations of their ability to protect themselves simply by speaking up. She wants the government to be able to rob such of the corporations as are wealthy of their property and income. She wants to keep small corporations from becoming large ones. She and other Progressive Elitists want them disarmed completely so that labor unions who have lost the interest of private sector workers can once again with government help increase their private sector membership far above its recent anemic percentage. Of course these unions are expected to pay a pretty penny to the Democrat Socialist Party election coffers and provide huge numbers of free workers during the campaign. The constitutional amendment Pelosi is backing is designed to disarm everyone who is in an association with others in the form of a corporation.
The bigger government gets, the less willing it is to brook opposition to its power. The danger is not from people associated in corporations, which operate in the private sector. It is from government, which demands a monopoly on the use of force and would like to have a monopoly on the use of speech as well. The sword is not enough. Government also wants control of the pen.
There is a completely irrelevant claim that a corporation is not a person, therefore it can be muzzled. This ignores the very obvious fact that individuals actually do the speaking. It ignores the fact that the speaker has voluntarily chosen an association with a set of other individuals in order to pursue values and goals of his own choosing in the private sector. The particular association is a legal entity which offers some protections of the assets of the individuals who own and manage the legal entity. The mere fact that they seek these legal protections should not deprive them of the right to speak freely.
It is important to be aware of the fact that the corporation form of association may apply to a giant or a micro business. It may apply to a think tank or to a charitable organization. The association of people pursuing common goals in the private sector as a corporation does not imply that these goals are either moral or immoral, and it does not imply that government has any legitimate purpose in promoting or thwarting the goals of the individuals using their freedom of association in the private sector to cooperate closely with others in the association organization called a corporation.
Because government all too often tries to interfere with the rights of individuals in voluntary associations in the private sector, the organization of individuals may have a very dire need to protect their common interests from the government. This means that there are very important joint efforts the associated individuals will want to take to influence the outcome of an election. They have as much right to do so as members of a bridge club or book club do. They have as much right as those in a business organized as a LLC or a LLLLP. They have as much right as those in a business organized as a partnership. They have as much a right to freedom of speech as do members of a church or of a family. As the Supreme Court very wisely pointed out, the fact that an individual has exercised his freedom of association should not deprive him of his freedom of speech. There is no case in which the exercise of one freedom should deprive us of our other freedoms.
Some people want to deprive the persons involved in a corporation's activities of their freedom of speech because they see some corporations as very powerful. They fear that this power will badly influence government policies. Of course, they ignore the fact that if the government were as limited in power as is mandated by the Constitution, then there would be little reason for the people in a corporation to fear the government and little reason for them to make the effort to try to control or influence the policies of the government. Any problems that do result from big corporations using their money to influence elections are the result of excessive and illegitimate government.
Of course, Nancy Pelosi is an advocate of unlimited government. She is most eager to deprive people associated in corporations of their ability to protect themselves simply by speaking up. She wants the government to be able to rob such of the corporations as are wealthy of their property and income. She wants to keep small corporations from becoming large ones. She and other Progressive Elitists want them disarmed completely so that labor unions who have lost the interest of private sector workers can once again with government help increase their private sector membership far above its recent anemic percentage. Of course these unions are expected to pay a pretty penny to the Democrat Socialist Party election coffers and provide huge numbers of free workers during the campaign. The constitutional amendment Pelosi is backing is designed to disarm everyone who is in an association with others in the form of a corporation.
The bigger government gets, the less willing it is to brook opposition to its power. The danger is not from people associated in corporations, which operate in the private sector. It is from government, which demands a monopoly on the use of force and would like to have a monopoly on the use of speech as well. The sword is not enough. Government also wants control of the pen.
13 April 2012
The Medieval Warm Period and the Little Ice Age Were Worldwide
The catastrophic anthropogenic global warming alarmists have consistently downplayed both the Medieval Warm Period and the Little Ice Age. They have tried to reduce the warmth of the former and reduce the coldness of the latter. They have claimed that these events were limited to Europe or to the Northern Hemisphere. There has actually been a plethora of evidence that these were worldwide events as is discussed in Ian Plimer's book Heaven and Earth, but most of the evidence was obtained in the Northern Hemisphere as discussed in my earlier post. A very interesting new study has shown that both events took place in the Antarctic Peninsula as well.
Zunli Lu of Syracuse University and a host of colleagues from Oxford University, Bangor University, the University of Bristol, the University of Leeds, the Diamond Light Source, Houston University, and Rice University have published An ikaite record of late Holocene climate at the Antarctic Peninsula in Earth and Planetary Science Letters. Ikaite crystals are a form of calcium carbonate or limestone and only form under cold conditions. They melt at room temperature. The oxygen isotope concentration in the crystals can be measured and provides a history of the temperature when the crystals were formed. Lu and his colleagues were able to find and date ikaite crystals from the Antarctic Peninsula and construct the temperature record. They found that both the Medieval Warm Period and the Little Ice Age occurred in the Antarctic.
This is important because it says that the recent worldwide warming is not unprecedented and it is not necessary to believe that only man's emissions of carbon dioxide can explain that unprecedented warming. Atmospheric carbon dioxide concentrations were not as high at the time of the Medieval Warm Period and are not needed to explain it. In addition, the Little Ice Age ended as the Industrial Revolution got into gear. The increase of carbon dioxide since then is at least substantially due to the worldwide warming of the oceans, which have immense quantities of dissolved carbon dioxide and solid carbonates in them. It is known that the warming ocean waters evolve carbon dioxide and those waters have certainly been warming since the end of the Little Ice Age. It is a matter of major consequence therefor that both the Medieval Warm Period and the Little Ice Age appear to have been worldwide events.
Zunli Lu of Syracuse University and a host of colleagues from Oxford University, Bangor University, the University of Bristol, the University of Leeds, the Diamond Light Source, Houston University, and Rice University have published An ikaite record of late Holocene climate at the Antarctic Peninsula in Earth and Planetary Science Letters. Ikaite crystals are a form of calcium carbonate or limestone and only form under cold conditions. They melt at room temperature. The oxygen isotope concentration in the crystals can be measured and provides a history of the temperature when the crystals were formed. Lu and his colleagues were able to find and date ikaite crystals from the Antarctic Peninsula and construct the temperature record. They found that both the Medieval Warm Period and the Little Ice Age occurred in the Antarctic.
This is important because it says that the recent worldwide warming is not unprecedented and it is not necessary to believe that only man's emissions of carbon dioxide can explain that unprecedented warming. Atmospheric carbon dioxide concentrations were not as high at the time of the Medieval Warm Period and are not needed to explain it. In addition, the Little Ice Age ended as the Industrial Revolution got into gear. The increase of carbon dioxide since then is at least substantially due to the worldwide warming of the oceans, which have immense quantities of dissolved carbon dioxide and solid carbonates in them. It is known that the warming ocean waters evolve carbon dioxide and those waters have certainly been warming since the end of the Little Ice Age. It is a matter of major consequence therefor that both the Medieval Warm Period and the Little Ice Age appear to have been worldwide events.
09 April 2012
Coal-Fired Power Plants Produce Insignificant Mercury
Back in December, I wrote about the absurdity of the EPA claim that coal-fired power plants produced significant mercury which necessitated drastic reductions at any cost. I was then puzzled that the EPA did not produce maps of the mercury concentrations that would show the mercury was found in higher concentrations downwind of coal-fired power plants. It turns out that maps of the concentrations of mercury do exist and can be examined. The National Atmospheric Deposition Program produces annual maps of the mercury concentrations across the USA here. Note that the mercury high concentration areas changed somewhat between 2009 and 2010, but coal-fired power plants do not have giant chicken legs to rise up and walk to a new location. But, the highest mercury concentrations are in the Southern Rocky Mountains and in the plains states just to the west of those southern Rocky Mountains.
The hottest areas for mercury are the states of Nevada, Arizona, New Mexico, Utah, Colorado, Kansas, Nebraska, South Dakota and other states near them. Florida is a bit warm also. So one would conclude that most of our coal-fired power plants are in southern California and the Southwest in general. I do not know how one would explain the high concentrations in Florida. But let us look at where the coal-fired power plants are then.
Of course, as you already knew, most of them are in the eastern half of the United States. There are only a few dinky coal-fired power plants in southern California and most of those in Arizona are in northeastern Arizona. There is a large concentration of coal-fired power plants in the Ohio River Valley and no lack of them in Mississippi, Georgia, South Carolina, North Carolina, Virginia, Maryland, and Pennsylvania. Despite this huge concentration of coal-fired power plants, the East Coast Mid-Atlantic states are relatively green, which means they have lower mercury concentrations than the western part of the USA. Being downwind of a coal-fired power plant does not appear to be anything like as important a factor as natural geographic sources of mercury are. The mercury concentration maps give no hint of a mercury plume to the east of a power plant or even to the east of a concentration of large coal-fired power plants. We should see such a plume due to the prevailing wind direction.
Update: I noted in my earlier post referred to above that coal-fired power plants produce about 41 to 48 tons of mercury a year. That post observed that forest fires in the US were estimated to release about 48 tons of mercury a year. Most of the big forest fires occur in the West, especially in many areas consistent with high concentrations in this map due to dry climates and low population densities drawing fewer fire-fighters. If these were the only sources of mercury, then the distribution of mercury across the US would still not differ much East to West since the forest fires of the West would be balanced by the higher concentration of coal-fired power plants in the East.
So what is the likely cause of the high mercury concentrations that are observed in the Southern Rockies and in the plains states to the west, especially the northwest, of them? In comparison to these puny sources of mercury, volcanoes, subsea vents, and geysers are thought to produce 9 to 10K tons of mercury a year. The areas of high mercury concentrations do not correlate very well with the newer and more active volcanoes of the Pacific Northwest in the US, however. But, it turns out that they correlate well with the old volcanoes of the Rocky Mountains shown in white in the map here and shown below:
It is well-known to geologists that the southern Rocky Mountains are much richer in minerals and precious metals than the northern Rockies because volcanoes and rising magma played a much greater role in their formation. I expect the high mercury concentration areas are due to the erosion of mercury mineral deposits, commonly cinnabar, in these old volcanoes and from their environs. The mercury released by forest fires is clear evidence that there is substantial mercury in the ground in the West already distributed about. The Rockies have been eroding for a very long time now and mercury is distributed over long distances from these old volcanoes by winds and eastward flowing rivers. The rivers flow into the Mississippi, so none of the mercury they transport goes east of the Mississippi River. This is my best guess about the source in any case. Update End.
Once again we see that the EPA does not use rational science to govern its actions, even when those actions will have drastic negative consequences for the economy and put many people out of jobs. Hauling coal by train to power plants, operating the power plants, and extracting coal from the ground all provide many hard-working Americans with jobs. We also have huge coal reserves, which it makes more sense to burn to create electricity than it does to use natural gas which is better for making plastics and other products. Of course, now natural gas is inexpensive and it is being used to generate electricity. I am happy to leave how it will be used to the free market, but I do not want the EPA under the guidance of the ever-foolish Obama pushing and shoving the free market to influence such decisions.
The hottest areas for mercury are the states of Nevada, Arizona, New Mexico, Utah, Colorado, Kansas, Nebraska, South Dakota and other states near them. Florida is a bit warm also. So one would conclude that most of our coal-fired power plants are in southern California and the Southwest in general. I do not know how one would explain the high concentrations in Florida. But let us look at where the coal-fired power plants are then.
Of course, as you already knew, most of them are in the eastern half of the United States. There are only a few dinky coal-fired power plants in southern California and most of those in Arizona are in northeastern Arizona. There is a large concentration of coal-fired power plants in the Ohio River Valley and no lack of them in Mississippi, Georgia, South Carolina, North Carolina, Virginia, Maryland, and Pennsylvania. Despite this huge concentration of coal-fired power plants, the East Coast Mid-Atlantic states are relatively green, which means they have lower mercury concentrations than the western part of the USA. Being downwind of a coal-fired power plant does not appear to be anything like as important a factor as natural geographic sources of mercury are. The mercury concentration maps give no hint of a mercury plume to the east of a power plant or even to the east of a concentration of large coal-fired power plants. We should see such a plume due to the prevailing wind direction.
Update: I noted in my earlier post referred to above that coal-fired power plants produce about 41 to 48 tons of mercury a year. That post observed that forest fires in the US were estimated to release about 48 tons of mercury a year. Most of the big forest fires occur in the West, especially in many areas consistent with high concentrations in this map due to dry climates and low population densities drawing fewer fire-fighters. If these were the only sources of mercury, then the distribution of mercury across the US would still not differ much East to West since the forest fires of the West would be balanced by the higher concentration of coal-fired power plants in the East.
So what is the likely cause of the high mercury concentrations that are observed in the Southern Rockies and in the plains states to the west, especially the northwest, of them? In comparison to these puny sources of mercury, volcanoes, subsea vents, and geysers are thought to produce 9 to 10K tons of mercury a year. The areas of high mercury concentrations do not correlate very well with the newer and more active volcanoes of the Pacific Northwest in the US, however. But, it turns out that they correlate well with the old volcanoes of the Rocky Mountains shown in white in the map here and shown below:
It is well-known to geologists that the southern Rocky Mountains are much richer in minerals and precious metals than the northern Rockies because volcanoes and rising magma played a much greater role in their formation. I expect the high mercury concentration areas are due to the erosion of mercury mineral deposits, commonly cinnabar, in these old volcanoes and from their environs. The mercury released by forest fires is clear evidence that there is substantial mercury in the ground in the West already distributed about. The Rockies have been eroding for a very long time now and mercury is distributed over long distances from these old volcanoes by winds and eastward flowing rivers. The rivers flow into the Mississippi, so none of the mercury they transport goes east of the Mississippi River. This is my best guess about the source in any case. Update End.
Once again we see that the EPA does not use rational science to govern its actions, even when those actions will have drastic negative consequences for the economy and put many people out of jobs. Hauling coal by train to power plants, operating the power plants, and extracting coal from the ground all provide many hard-working Americans with jobs. We also have huge coal reserves, which it makes more sense to burn to create electricity than it does to use natural gas which is better for making plastics and other products. Of course, now natural gas is inexpensive and it is being used to generate electricity. I am happy to leave how it will be used to the free market, but I do not want the EPA under the guidance of the ever-foolish Obama pushing and shoving the free market to influence such decisions.
08 April 2012
The Ever-Vanishing Jobs Recovery
Once more the wisp of a hint of a jobs recovery from the never-ending Great Socialist Recession has vanished as mist before our eyes in the early hours of the morning. Obama and the socialist Senate have once again succeeded with their anti-business rhetoric, past law-creation, and present regulatory harassment to push investors into inactivity. Rationally these investors will not invest and create jobs in the private sector to a degree that will allow Americans to once again proudly earn a living because they cannot reasonably see profits under the present regime in Washington.
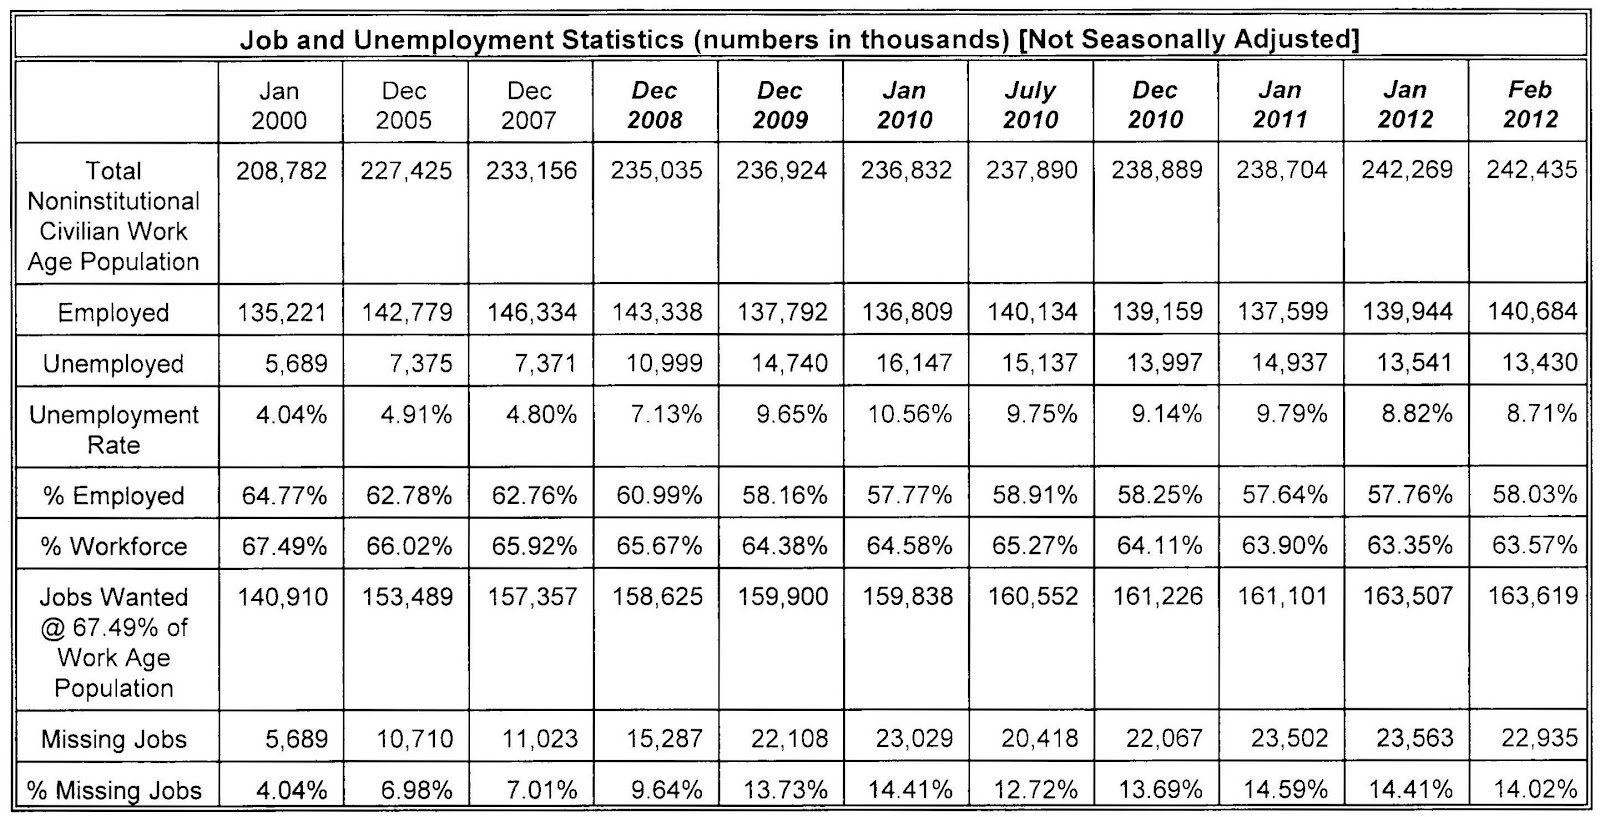
Let us examine the consequences of the March employment numbers from the Bureau of Labor Statistics. They are summarized in the following table, which uses the non-seasonally adjusted numbers:
Now the unemployment rate is not very meaningful in a recession in stasis, as I point out almost every month, due to many who would like to work giving up in despair or going back to school or into training in hopes of later having a chance for a job. Some do continue to search for a job, but have simply given up on those methods which make them visible to the BLS. It is more meaningful to examine the number for the percentage of the employed as a part of the total non-institutional civilian working age population.
In March 2012, the employed were 58.29% of the working age population. This compares to 58.14% in March 2011. So in the last year of so-called recovery we advanced the percentage of employed by 0.15%! There is not much to show for the last year there. How does the March 2012 case compare with March 2010? In March 2010, the percentage of workers to the working age population was 58.18%, so in two years of "recovery" the percentage of the employed increased by ....... 0.11%!!!! Is this recovery underwhelming, or what? It would appear that John Galt is on strike. We have returned to the stasis of the caveman's era.
Assuming that as large a fraction of the population would like to be working today as did in January 2000 when good jobs were plentiful, we can calculate the number of missing jobs. The updated plot of the number of missing jobs is given below:
There is nothing exceptional about March and its comparison with the two previous Marches. The same is true for Februaries or for Januaries or any other month over the last two years. There has been no improvement in the jobs situation at all. All the talk about new jobs being created has fallaciously attempted to misdirect the listener from the fact that the jobs created have only been enough to keep pace with population growth, but not enough to rehire the millions of Americans who lost jobs in the deepest part of the recession. The media has largely been a propaganda tool. We still have 22.321 million jobs missing in our economy! Without a major change in the November 2012 election, this situation will continue. We will have settled into the chronic unemployment rates of many of the socialist European countries into which Obama set out to transform the USA.
Let us examine the consequences of the March employment numbers from the Bureau of Labor Statistics. They are summarized in the following table, which uses the non-seasonally adjusted numbers:
Now the unemployment rate is not very meaningful in a recession in stasis, as I point out almost every month, due to many who would like to work giving up in despair or going back to school or into training in hopes of later having a chance for a job. Some do continue to search for a job, but have simply given up on those methods which make them visible to the BLS. It is more meaningful to examine the number for the percentage of the employed as a part of the total non-institutional civilian working age population.
In March 2012, the employed were 58.29% of the working age population. This compares to 58.14% in March 2011. So in the last year of so-called recovery we advanced the percentage of employed by 0.15%! There is not much to show for the last year there. How does the March 2012 case compare with March 2010? In March 2010, the percentage of workers to the working age population was 58.18%, so in two years of "recovery" the percentage of the employed increased by ....... 0.11%!!!! Is this recovery underwhelming, or what? It would appear that John Galt is on strike. We have returned to the stasis of the caveman's era.
Assuming that as large a fraction of the population would like to be working today as did in January 2000 when good jobs were plentiful, we can calculate the number of missing jobs. The updated plot of the number of missing jobs is given below:
There is nothing exceptional about March and its comparison with the two previous Marches. The same is true for Februaries or for Januaries or any other month over the last two years. There has been no improvement in the jobs situation at all. All the talk about new jobs being created has fallaciously attempted to misdirect the listener from the fact that the jobs created have only been enough to keep pace with population growth, but not enough to rehire the millions of Americans who lost jobs in the deepest part of the recession. The media has largely been a propaganda tool. We still have 22.321 million jobs missing in our economy! Without a major change in the November 2012 election, this situation will continue. We will have settled into the chronic unemployment rates of many of the socialist European countries into which Obama set out to transform the USA.
04 April 2012
Congress is Disrespected, but Incumbents Almost Always Re-elected
The Cato Institute is having a forum called Citizens v. The Ruling Elite. I am copying the announcement I just received below. Please read the text on Congress, how much it is disrespected by the American people, and yet how often the incumbent incompetent Congressman is re-elected. Then I will show you my new Congressional District Map as supporting evidence of how carefully we are controlled by the political party dominant in our home state.
featuring
Mark Meckler
Co-founder, Tea Party Patriots
Eric O’Keefe
Co-Chairman, Campaign for Primary Accountability
Geoff Pallay
Special Projects Director, Ballotpedia
moderated by
John Samples
Director, Center for Representative Government, Cato Institute
Only 12 percent of Americans now approve of the job Congress is doing. Despite that, incumbents are overwhelmingly re-elected. Eighty-six percent of them survived the 2010 elections for the House of Representatives. That’s not much of a surprise when you consider that 80 percent of House districts are safe for one of the two major parties and 62 percent of incumbents face no primary challenge at all. No wonder many Americans feel those who “represent” them in Washington don’t really represent them at all. A new organization, the Campaign for Primary Accountability, is trying to level the playing field and to restore real representation by making incumbents more accountable to citizens. Its efforts have won praise across the political spectrum and condemnation from fans of the status quo. But it is not alone. Mark Meckler, a founder of the Tea Party Patriots, is launching a new effort to change American elections for the better. Please join us to hear these leaders talk about their continuing struggle to take back America.
Friday, April 20, 2012
Noon
(Luncheon to follow)
F. A. Hayek Auditorium • Cato Institute
1000 Massachusetts Ave., N.W., Washington, D.C. 20001
I was until recently in the highly gerrymandered 4th Congressional District in Maryland, once known as the Free State. This district consistently elected whichever highly socialist black candidate won the Democrat primary. For years this has been Donna Edwards, a member of the Democrat Socialist Caucus in the House of Representatives. I am now in District 3 which is represented by John Sarbanes of Towson, a town north of Baltimore. I live in the northeastern part of Montgomery County. The District 3 map after the 2000 Census re-districting was as shown below:
Clearly the people in this district were lumped together because of their similarity of interests and because it would be very easy for their Congressman to gather them together in town hall forums to learn about their concerns with government. OK, yes, I am being sarcastic. Clearly the interests of the people were of no concern and that is indicated by the boundaries of this district. The 2010 Census lead to a re-districting plan and Congressional District 3, in which Democrat John Sarbanes, of the infamous Sarbanes-Oxley accounting burden law, is running for re-election now has a very different look. This is because the Democrats believe they can challenge and remove the 20-year Republican Congressman Bartlett of the 6th Congressional District in Western Maryland with the new 6th District. The new District 3 that I am in looks like this:
This is a district composed of fragments of Montgomery County, Anne Arundel County, Howard County, Baltimore City County, Baltimore County, and Carroll County. There is no complete county in the district. Most of the Montgomery and Howard County citizens along U.S. 29 are federal employees. Large numbers of state employees live in and near Annapolis in this district. A fraction of the district citizens would have a special interest in issues relating to the Chesapeake Bay, but many would not. Substantial areas are very rural. This district is not only designed to take high population density Democrat areas and combine them with many rural areas with many Republicans in them, but it is also a classic case of divide and conquer. Any of many special interest groups that might become angry at John Sarbanes or another Representative is perfectly incapable of preventing his re-election due their fragmentation between the 8 Congressional districts in Maryland.
I challenge anyone to present me with a Congressional district in which they live that can rival mine as the very symbol of gerrymandered excess! If the people ever want to have a chance to control Congress, they will have to insist that their states use algorithms for forming Congressional districts that make the districts reasonably compact, honor local government boundaries such as county lines, and make it more likely that people with similar concerns will be in the same district. The divide and conquer issue is a very rational concern which ought to be addressed. This is government dividing and conquering the People!
Citizens v. the Ruling Elite
featuring
Mark Meckler
Co-founder, Tea Party Patriots
Eric O’Keefe
Co-Chairman, Campaign for Primary Accountability
Geoff Pallay
Special Projects Director, Ballotpedia
moderated by
John Samples
Director, Center for Representative Government, Cato Institute
Only 12 percent of Americans now approve of the job Congress is doing. Despite that, incumbents are overwhelmingly re-elected. Eighty-six percent of them survived the 2010 elections for the House of Representatives. That’s not much of a surprise when you consider that 80 percent of House districts are safe for one of the two major parties and 62 percent of incumbents face no primary challenge at all. No wonder many Americans feel those who “represent” them in Washington don’t really represent them at all. A new organization, the Campaign for Primary Accountability, is trying to level the playing field and to restore real representation by making incumbents more accountable to citizens. Its efforts have won praise across the political spectrum and condemnation from fans of the status quo. But it is not alone. Mark Meckler, a founder of the Tea Party Patriots, is launching a new effort to change American elections for the better. Please join us to hear these leaders talk about their continuing struggle to take back America.
Noon
(Luncheon to follow)
F. A. Hayek Auditorium • Cato Institute
1000 Massachusetts Ave., N.W., Washington, D.C. 20001
I was until recently in the highly gerrymandered 4th Congressional District in Maryland, once known as the Free State. This district consistently elected whichever highly socialist black candidate won the Democrat primary. For years this has been Donna Edwards, a member of the Democrat Socialist Caucus in the House of Representatives. I am now in District 3 which is represented by John Sarbanes of Towson, a town north of Baltimore. I live in the northeastern part of Montgomery County. The District 3 map after the 2000 Census re-districting was as shown below:
Clearly the people in this district were lumped together because of their similarity of interests and because it would be very easy for their Congressman to gather them together in town hall forums to learn about their concerns with government. OK, yes, I am being sarcastic. Clearly the interests of the people were of no concern and that is indicated by the boundaries of this district. The 2010 Census lead to a re-districting plan and Congressional District 3, in which Democrat John Sarbanes, of the infamous Sarbanes-Oxley accounting burden law, is running for re-election now has a very different look. This is because the Democrats believe they can challenge and remove the 20-year Republican Congressman Bartlett of the 6th Congressional District in Western Maryland with the new 6th District. The new District 3 that I am in looks like this:
This is a district composed of fragments of Montgomery County, Anne Arundel County, Howard County, Baltimore City County, Baltimore County, and Carroll County. There is no complete county in the district. Most of the Montgomery and Howard County citizens along U.S. 29 are federal employees. Large numbers of state employees live in and near Annapolis in this district. A fraction of the district citizens would have a special interest in issues relating to the Chesapeake Bay, but many would not. Substantial areas are very rural. This district is not only designed to take high population density Democrat areas and combine them with many rural areas with many Republicans in them, but it is also a classic case of divide and conquer. Any of many special interest groups that might become angry at John Sarbanes or another Representative is perfectly incapable of preventing his re-election due their fragmentation between the 8 Congressional districts in Maryland.
I challenge anyone to present me with a Congressional district in which they live that can rival mine as the very symbol of gerrymandered excess! If the people ever want to have a chance to control Congress, they will have to insist that their states use algorithms for forming Congressional districts that make the districts reasonably compact, honor local government boundaries such as county lines, and make it more likely that people with similar concerns will be in the same district. The divide and conquer issue is a very rational concern which ought to be addressed. This is government dividing and conquering the People!
28 March 2012
ObamaCare Fundamentally Violates American Contract Law
Most informed Americans are aware that the constitutionality of ObamaCare (the maliciously and fallaciously labelled Patient Protection and Affordable Care Act) is being challenged on the grounds that:
This individual mandate is the first time Congress has made a law under its commerce power that allows an individual no means of escape from its compelling them to an action. The Founding generation understood that government should not have the power to force individuals to engage in commercial transactions against their will. Commercial transactions imply a contract and a contract has always required mutual consent in Anglo-American law. Contract law would be gutted in its entirety if this mutual consent requirement were disposed of and no contracts would then be binding upon the parties to the contract. A contract would be a concept without meaning.
The Institute for Justice amicus brief further argues that if Congress exercised a power to wipe out the doctrine of mutual assent, this would not be a proper action under the Necessary and Proper Clause. Chief Justice Marshall declared in McCulloch v. Maryland that a law was necessary and proper only if the end was legitimate and it was consistent with the letter and spirit of the Constitution. Compelling individuals to engage in commerce ends the concept of contractual mutuality of assent and is not consistent with the letter and spirit of the Constitution.
Destroying the principle of mutual assent is the last step in creating a general federal police power to control the lives, liberties, and property of the people and the internal order, improvement, and prosperity of the State. This general police power had been reserved to the States, as stated in The Federalist No. 45 by James Madison. The Supreme Court recently stated in Bond v. United States that the purpose of the Constitution's enumeration of powers and federalism was to protect the individual rights of the citizens. If Congress were allowed to force individuals to purchase health insurance under contract, this would destroy a fundamental precept of contract law and drastically reduce individual liberty.
David N. Mayer, Professor of Law and History, at Capital Law School, makes an additional argument on his blog. He says
One should be able to simply state the obvious fact that ObamaCare deprives the citizen of life by not allowing him to control his health and medical care as needed to preserve his life and to flourish in it, it deprives him of liberty, it turns the ownership of his mind and body over to a collective, and it denies him the right to pursue his happiness in many critical ways. It clearly violates the 9th Amendment protection of our essential individual rights not explicitly named in the Bill of Rights. Who then could have imagined that the federal government would try to control everyone's health and medical care.
It cannot be more clear that ObamaCare is an individual rights Obamanation, that synonym for abomination. Unfortunately, the modern American cannot hold a candle to the Founding Generation when it comes to individual rights. Even so, ObamaCare is such an obvious violation of the Constitution that 72% of Americans realize that it is unconstitutional. Let us hope that 55.55% of the Justices of the Supreme Court also understand this. We know that at least Justice Clarence Thomas Stands Sure on this, providing Liberty a sure 11.11%.
The family motto of the Scot Andersons is Stand Sure.
- Congress does not have the power to compel a commercial activity an individual is not engaged in under the Commerce Clause, so the individual mandate to buy government-approved health insurance is unconstitutional.
- Congress cannot invoke the Necessary and Proper Clause under the taxing power as the source of the power to levy penalties because this is not proper. The amicus brief by the Washington Legal Foundation explains this argument.
- the new conditions on all federal Medicaid funding such as expanding eligibility, coverage for pre-existing conditions, and mandated services, constitute an unconstitutional coercion of the states as explained in this amicus brief. This argument is given some additional weight by virtue of the fact that a majority of the states have joined in the lawsuit opposing ObamaCare and the federal effort to take over the police power of the states guaranteed in the 10th Amendment.
This individual mandate is the first time Congress has made a law under its commerce power that allows an individual no means of escape from its compelling them to an action. The Founding generation understood that government should not have the power to force individuals to engage in commercial transactions against their will. Commercial transactions imply a contract and a contract has always required mutual consent in Anglo-American law. Contract law would be gutted in its entirety if this mutual consent requirement were disposed of and no contracts would then be binding upon the parties to the contract. A contract would be a concept without meaning.
The Institute for Justice amicus brief further argues that if Congress exercised a power to wipe out the doctrine of mutual assent, this would not be a proper action under the Necessary and Proper Clause. Chief Justice Marshall declared in McCulloch v. Maryland that a law was necessary and proper only if the end was legitimate and it was consistent with the letter and spirit of the Constitution. Compelling individuals to engage in commerce ends the concept of contractual mutuality of assent and is not consistent with the letter and spirit of the Constitution.
Destroying the principle of mutual assent is the last step in creating a general federal police power to control the lives, liberties, and property of the people and the internal order, improvement, and prosperity of the State. This general police power had been reserved to the States, as stated in The Federalist No. 45 by James Madison. The Supreme Court recently stated in Bond v. United States that the purpose of the Constitution's enumeration of powers and federalism was to protect the individual rights of the citizens. If Congress were allowed to force individuals to purchase health insurance under contract, this would destroy a fundamental precept of contract law and drastically reduce individual liberty.
David N. Mayer, Professor of Law and History, at Capital Law School, makes an additional argument on his blog. He says
There’s also a third major ground for finding the law unconstitutional – unfortunately, not an issue on which the Court granted certiorari (review), but an issue that ought to be raised in some of the other amicus briefs: that the law abridges individual freedom, particularly the right to health-care freedom (the right of individuals to decide for themselves whether they should have health-care insurance and, if so, what sort of coverage they have), a right that ought to be protected under the Fifth Amendment’s due process clause as a part of the fundamental right to liberty that clause protects. (This most powerful argument against “ObamaCare,” unfortunately, is also one that the Court likely will ignore, as it would require the Court to reverse some 70 years or so of precedents – of erroneous interpretation of the Constitution – following the so-called “New Deal revolution” of the late 1930s.)These arguments are all good arguments, but it seems very clear to me that the Founding generation intended the Constitution to provide us with a federal government which was legitimate as defined in the Declaration of Independence. Such a government, strictly constrained in power as the Constitution intended, was to have the purpose of protecting the equal, sovereign individual right to life, liberty, property, the ownership of one's own body and mind, and the pursuit of happiness. My addition of property and the ownership of one's mind and body is to remind today's ahistorical citizen that these rights are inseparable from the more briefly stated life, liberty, and the pursuit of happiness phrase of the Declaration of Independence. The citizen of the late 18th Century knew this.
One should be able to simply state the obvious fact that ObamaCare deprives the citizen of life by not allowing him to control his health and medical care as needed to preserve his life and to flourish in it, it deprives him of liberty, it turns the ownership of his mind and body over to a collective, and it denies him the right to pursue his happiness in many critical ways. It clearly violates the 9th Amendment protection of our essential individual rights not explicitly named in the Bill of Rights. Who then could have imagined that the federal government would try to control everyone's health and medical care.
It cannot be more clear that ObamaCare is an individual rights Obamanation, that synonym for abomination. Unfortunately, the modern American cannot hold a candle to the Founding Generation when it comes to individual rights. Even so, ObamaCare is such an obvious violation of the Constitution that 72% of Americans realize that it is unconstitutional. Let us hope that 55.55% of the Justices of the Supreme Court also understand this. We know that at least Justice Clarence Thomas Stands Sure on this, providing Liberty a sure 11.11%.
The family motto of the Scot Andersons is Stand Sure.
19 March 2012
Obama: Oil is the Energy of the Past - Utterly Fallacious
In campaign speech after campaign speech, Obama has said that oil is the energy of the past. This is another example of his dedication to making fallacious arguments. Of course that statement is true, but fallacious has two meanings: 1) embodying a fallacy, and 2) tending to deceive or mislead; delusive. Obama is a verbal magician apparently able to deceive about half of all Americans with his ability to make the misdirection argument. The most momentary thought will allow anyone to recognize that our cars almost exclusively operate on gasoline or the occasional diesel, today. Of course both are oil products. This makes oil the energy of today and some set of our tomorrows.
What is more, while Obama would like us to think electric cars will dominate tomorrow, any sane observer doubts they will dominate even in ten or twenty years. Despite large tax credits and a certain political correctness in some crowds, electric vehicles are managing to sell only in the few hundreds a month.
Indeed, the as yet mythical 54.5 mpg cars that Obama likes to claim will reduce our oil consumption would not even be needed if electric cars are soon to replace gasoline-fueled cars. If gasoline is going to be challenged, it is more likely the challenge will come from cars operating on natural gas, which has recently become very inexpensive thanks to the economic development of shale oil and gas deposits. Yet, shale oil deposits will also give prolonged life to gasoline, so it is hardly the energy only of the past.
Another mainstay argument Obama is using in his campaign speeches is that the U.S. consumes 20% of the world's oil consumption, but has only 2% of its oil reserves. This is another fallacious argument. Once again, not because these numbers are wrong, but because they are meant to deceive. Oil reserves is a shortening of proven oil reserves. Oil in the ground is not a proven oil reserve until and unless the price of oil is high enough to allow its profitable removal using available technology. As the price of oil goes up, the proven reserves tend to go up. As technology improves, the proven reserves of oil increase. In addition, an oil field has to be developed to a fair extent before there is an accurate enough assessment of how much oil there can be economically extracted with the available technology. The development of an oil field is a very expensive enterprise, so it is generally done only as oil is needed. In other words, it does not pay to prove a very large reserve of oil.
Why does Obama make this statement in all of his campaign speeches? First, he is trying to minimize his guilt for the present rising oil and gasoline prices at this awkward time not long before he comes up for re-election. He is making the argument that increasing America's reserves will do little to change the price of oil and gasoline because our reserves will still be small compared to our needs. This excuses his many efforts to slow the approval of drilling permits offshore and on federal lands. It excuses his discouraging risky drilling by increasing the royalties on oil extracted from federal lands and offshore from a level similar to that paid to private landowners to one 50% higher. Contrary to the claims of many leftists, most of the federal lands are not National Parks and are classified as open to oil and gas drilling. Drilling in the Gulf of Mexico in 2012 is expected to be 30% less than had been expected prior to the moratorium according to a recent commentary by Charles Krauthammer. He also notes that leases in federal lands in the Rocky Mountains are down by 70% since Obama has been in office.
Less directly, the statement also tends to excuse his denying Americans more access to Canadian oil and easier access to the Bakken Formation oil of North Dakota, Montana, and South Dakota by his failure to approve the Keystone XL pipeline. It tends to excuse his failure to lift the ethanol mandate that only makes our gasoline more expensive, as well as our food.
Second, he is trying to use the 2% reserves statement to imply that our oil is almost gone and that makes oil the energy of the past. It justifies his so far fruitless efforts to develop electric cars as an alternative transportation mode. It also justifies his draconian mandate that cars will have to have a 54.5 mpg gasoline efficiency, no matter what the increased cost of the cars may be and no matter how much their safety may be lessened.
Let us consider our past proven oil reserve situation. The Energy Information Administration (EIA) gathers oil reserves data by surveying private companies. Currently, these U.S. oil reserves are valued at 22 billion barrels of oil. This is the same as the reserves reported in much of the 1940s. Of course if the oil reserve were the oil in the ground in the U.S., we would have to subtract all the oil we had used from U.S. production since the 1940s and we could not possibly have the same amount of oil left now as we had then. Obviously, there is much more oil in the ground than is given by the oil reserve figure.
According to a 2006 report from the EIA, even then we knew we had 400 billion barrels of oil that could be recovered using the then current technologies. A Rand Corp. report found that there were an additional 800 billion barrels of oil shale in Wyoming and the surrounding states that could be extracted with current technology. That area alone could produce three times the oil in the reserves of Saudi Arabia. Altogether, the Green River Formation in Wyoming has an estimated 1.4 trillion barrels of oil shale according to the U.S. Geological Survey (USGS). The EIA updated map on our oil and gas shale formations as of May 2011 is shown below:
According to a variety of government data, the Institute for Energy Research has found that the U.S. has at least 1.4 trillion barrels of technically recoverable oil. This is about 200 years of our oil needs without any imports. The actual amount of oil is much higher for several reasons. First of all, almost every estimate of oil in an oil deposit area proves low. Once the field is more developed, it is found that there is more oil than was known early on. For instance, in 1995, the USGS thought there were 151 million barrels of recoverable oil in the Bakken Formation. In 2008, it increased the estimate to 3 to 4.3 billion barrels of oil. Current estimates run as high as 20 billion barrels of recoverable oil there with today's technology. The formation is estimated to have a total of 500 billion barrels of oil, much of which may be recoverable in the future. The earlier estimate of oil in the National Petroleum Reserve in Alaska was increased four-fold in 2002. Estimates of undiscovered oil are another 2.3 trillion barrels of oil. Basically, we are not on the verge of running out of oil.
What is more, with the U.S. development of the technology to extract oil from shale oil deposits, many new oil resources will be developed all around the world. For instance, oil shale deposits are known in Poland and in Great Britain. They will be discovered in many other places around the world. We will be able to import oil for a long time from other parts of the world as well as develop our own very extensive sources of oil. The reign of oil for our transportation needs need not be short. Of course, it will be fine if it is displaced by some better technology that is economically justified, but we are hardly in the dire straits Obama misleadingly claims we are in. The man is an evil magician directing our attention away from the critical and relevant facts.
Oddly enough, Obama may release oil from the Strategic Oil Reserve (SOR) once again as he did in June 2011 to convince voters that he is doing something about the high price of gasoline. There was a drop-off in oil from Libya then. He released 30 million barrels of oil from the Strategic Oil Reserve when the U.S. uses 20 million barrels of oil a day and the world was using 89 million barrels a day. It is incongruous that he could claim this release of such a small amount of oil would make a difference, but our developing our huge deposits of oil generally in the U.S. will make little difference! Actually, the release then of the oil from the Strategic Oil Reserve made no real difference in the price of oil or of gasoline. Compared to developing oil fields with billions of barrels of oil in them, a release of 30 million barrels is a very puny action. The market response to the last release of SOR oil was:
The effect on prices of this underwhelming 30 million barrels of oil was, well, underwhelming. Fortunately, over the longer haul, we are very able to extract much larger amounts of oil from within the U.S. and around the world than is being extracted today. This effort, if Obama would only allow it, will keep our oil price and gasoline price reasonable for quite some time. But with his placing offshore and federal land areas off limits for drilling with his super-slow permitting process and his high royalties, his policies will long leave us vulnerable to radical price fluctuations. Of course, he will falsely blame these on the natural scarcity of oil and the nefarious actions of speculators, as all good socialists do again and again.
Yet every investigation into the role of speculators shows them to have had no real negative or illegal effects. Good studies show that they in fact tend to smooth out price fluctuations. Their purpose is to anticipate changes in supply and demand and to try to see that they match one another. Only those who do not understand the market and supply and demand are readily deceived by this socialist claim that speculators are evil.
What is more, while Obama would like us to think electric cars will dominate tomorrow, any sane observer doubts they will dominate even in ten or twenty years. Despite large tax credits and a certain political correctness in some crowds, electric vehicles are managing to sell only in the few hundreds a month.
Indeed, the as yet mythical 54.5 mpg cars that Obama likes to claim will reduce our oil consumption would not even be needed if electric cars are soon to replace gasoline-fueled cars. If gasoline is going to be challenged, it is more likely the challenge will come from cars operating on natural gas, which has recently become very inexpensive thanks to the economic development of shale oil and gas deposits. Yet, shale oil deposits will also give prolonged life to gasoline, so it is hardly the energy only of the past.
Another mainstay argument Obama is using in his campaign speeches is that the U.S. consumes 20% of the world's oil consumption, but has only 2% of its oil reserves. This is another fallacious argument. Once again, not because these numbers are wrong, but because they are meant to deceive. Oil reserves is a shortening of proven oil reserves. Oil in the ground is not a proven oil reserve until and unless the price of oil is high enough to allow its profitable removal using available technology. As the price of oil goes up, the proven reserves tend to go up. As technology improves, the proven reserves of oil increase. In addition, an oil field has to be developed to a fair extent before there is an accurate enough assessment of how much oil there can be economically extracted with the available technology. The development of an oil field is a very expensive enterprise, so it is generally done only as oil is needed. In other words, it does not pay to prove a very large reserve of oil.
Why does Obama make this statement in all of his campaign speeches? First, he is trying to minimize his guilt for the present rising oil and gasoline prices at this awkward time not long before he comes up for re-election. He is making the argument that increasing America's reserves will do little to change the price of oil and gasoline because our reserves will still be small compared to our needs. This excuses his many efforts to slow the approval of drilling permits offshore and on federal lands. It excuses his discouraging risky drilling by increasing the royalties on oil extracted from federal lands and offshore from a level similar to that paid to private landowners to one 50% higher. Contrary to the claims of many leftists, most of the federal lands are not National Parks and are classified as open to oil and gas drilling. Drilling in the Gulf of Mexico in 2012 is expected to be 30% less than had been expected prior to the moratorium according to a recent commentary by Charles Krauthammer. He also notes that leases in federal lands in the Rocky Mountains are down by 70% since Obama has been in office.
Less directly, the statement also tends to excuse his denying Americans more access to Canadian oil and easier access to the Bakken Formation oil of North Dakota, Montana, and South Dakota by his failure to approve the Keystone XL pipeline. It tends to excuse his failure to lift the ethanol mandate that only makes our gasoline more expensive, as well as our food.
Second, he is trying to use the 2% reserves statement to imply that our oil is almost gone and that makes oil the energy of the past. It justifies his so far fruitless efforts to develop electric cars as an alternative transportation mode. It also justifies his draconian mandate that cars will have to have a 54.5 mpg gasoline efficiency, no matter what the increased cost of the cars may be and no matter how much their safety may be lessened.
Let us consider our past proven oil reserve situation. The Energy Information Administration (EIA) gathers oil reserves data by surveying private companies. Currently, these U.S. oil reserves are valued at 22 billion barrels of oil. This is the same as the reserves reported in much of the 1940s. Of course if the oil reserve were the oil in the ground in the U.S., we would have to subtract all the oil we had used from U.S. production since the 1940s and we could not possibly have the same amount of oil left now as we had then. Obviously, there is much more oil in the ground than is given by the oil reserve figure.
According to a 2006 report from the EIA, even then we knew we had 400 billion barrels of oil that could be recovered using the then current technologies. A Rand Corp. report found that there were an additional 800 billion barrels of oil shale in Wyoming and the surrounding states that could be extracted with current technology. That area alone could produce three times the oil in the reserves of Saudi Arabia. Altogether, the Green River Formation in Wyoming has an estimated 1.4 trillion barrels of oil shale according to the U.S. Geological Survey (USGS). The EIA updated map on our oil and gas shale formations as of May 2011 is shown below:
According to a variety of government data, the Institute for Energy Research has found that the U.S. has at least 1.4 trillion barrels of technically recoverable oil. This is about 200 years of our oil needs without any imports. The actual amount of oil is much higher for several reasons. First of all, almost every estimate of oil in an oil deposit area proves low. Once the field is more developed, it is found that there is more oil than was known early on. For instance, in 1995, the USGS thought there were 151 million barrels of recoverable oil in the Bakken Formation. In 2008, it increased the estimate to 3 to 4.3 billion barrels of oil. Current estimates run as high as 20 billion barrels of recoverable oil there with today's technology. The formation is estimated to have a total of 500 billion barrels of oil, much of which may be recoverable in the future. The earlier estimate of oil in the National Petroleum Reserve in Alaska was increased four-fold in 2002. Estimates of undiscovered oil are another 2.3 trillion barrels of oil. Basically, we are not on the verge of running out of oil.
What is more, with the U.S. development of the technology to extract oil from shale oil deposits, many new oil resources will be developed all around the world. For instance, oil shale deposits are known in Poland and in Great Britain. They will be discovered in many other places around the world. We will be able to import oil for a long time from other parts of the world as well as develop our own very extensive sources of oil. The reign of oil for our transportation needs need not be short. Of course, it will be fine if it is displaced by some better technology that is economically justified, but we are hardly in the dire straits Obama misleadingly claims we are in. The man is an evil magician directing our attention away from the critical and relevant facts.
Oddly enough, Obama may release oil from the Strategic Oil Reserve (SOR) once again as he did in June 2011 to convince voters that he is doing something about the high price of gasoline. There was a drop-off in oil from Libya then. He released 30 million barrels of oil from the Strategic Oil Reserve when the U.S. uses 20 million barrels of oil a day and the world was using 89 million barrels a day. It is incongruous that he could claim this release of such a small amount of oil would make a difference, but our developing our huge deposits of oil generally in the U.S. will make little difference! Actually, the release then of the oil from the Strategic Oil Reserve made no real difference in the price of oil or of gasoline. Compared to developing oil fields with billions of barrels of oil in them, a release of 30 million barrels is a very puny action. The market response to the last release of SOR oil was:
The effect on prices of this underwhelming 30 million barrels of oil was, well, underwhelming. Fortunately, over the longer haul, we are very able to extract much larger amounts of oil from within the U.S. and around the world than is being extracted today. This effort, if Obama would only allow it, will keep our oil price and gasoline price reasonable for quite some time. But with his placing offshore and federal land areas off limits for drilling with his super-slow permitting process and his high royalties, his policies will long leave us vulnerable to radical price fluctuations. Of course, he will falsely blame these on the natural scarcity of oil and the nefarious actions of speculators, as all good socialists do again and again.
Yet every investigation into the role of speculators shows them to have had no real negative or illegal effects. Good studies show that they in fact tend to smooth out price fluctuations. Their purpose is to anticipate changes in supply and demand and to try to see that they match one another. Only those who do not understand the market and supply and demand are readily deceived by this socialist claim that speculators are evil.
13 March 2012
Irresponsible Employment Reporting by the Opposition
The opposition media to Obama is irresponsibly and ineffectively performing its job for the American people. Since the government so-called seasonally adjusted unemployment rate started coming down, it has been common to see the Wall Street Journal headline that a jobs recovery is underway. Fox News program hosts have been making the same claims. This is a sad failure of the opposition media to inform Americans of the true situation as the much needed counter-punch to the power-grabbing socialist occupying the White House and his allies in the Senate.
Consider the 10-11 March 2012 issue of the Wall Street Journal: Jobs Recovery Gains Momentum blares the headline. The sub-headline was: U.S. Payrolls Climb 227,000 with Growth Across Industries; Unemployment Rate Holds at 8.3%. Now if this is a gain of momentum in jobs creation, how is it that the unemployment rate remained at 8.3%?
The answer, not given, might be that because more people found jobs, still more people entered the labor force, which is the sum of the employed and those actively looking for employment as seen by the government. Interestingly, one of graphs on the front page shows a small uptick in the labor force in February, but it is less than the down-tick in January was. What is more, the labor force plot is pretty much just downward in the second half of 2009 and all of 2010 and 2011. There had been an uptick in early 2010, but that is little more than noise on the major trendline. In fact, it was really just the effect of using seasonally adjusted data when the seasonal effect was somewhat out-of-whack because summer hiring was suppressed by a lack of construction jobs. Jobs creation momentum was falsely claimed then also. This WSJ significant graph of the labor force data is shown here:
So, I find myself totally puzzled about the Wall Street Journal evidence that we are seeing any jobs recovery, let alone one that is gaining momentum. The article does note that the economy has 5.2 million fewer jobs now than it had four years ago. It notes that the growing working age population ought to have many more jobs available than four years ago for the employed percentage to compare with the pre-Great Recession level. It observes that most economists say that "unemployment will remain elevated for years unless the pace of hiring accelerates." Indeed, it is just such acceleration that one would need to see to be able to say that the "Jobs Recovery Gains Momentum." Not only that, but one would need to see that acceleration apply to several months. Apparently fools write the headlines, which are all that most people see.
It seems that the economic or business reporters at the Wall Street Journal entrusted with the front page and the headlines just arbitrarily throw things into an article with no understanding of the Big Picture whatsoever. If the News Corporation, which owns Fox News, Fox News Business, and the Wall Street Journal cannot do better than this, it is no wonder the socialists are so often able to wrest control of our government. Even the opposition appears to have no economic judgment of note. It fails to point to the politically and economically crucial facts, so that our economically and business ignorant will become more knowledgeable. This response to the February jobs numbers out of the Bureau of Labor Statistics on the oppositions part is characteristic of their frequent failure to point out the significance of the data to the general public. It is terribly disappointing. If the voter is dumbed down, how will we ever counter the trend to worse and worse central planning by government?
A far more rational evaluation of the jobs numbers, with some perspective on the history during this recession, is given in my earlier post entitled Sick Economy has More Missing Jobs than in February 2010! The number of missing jobs, using the non-seasonally adjusted data of the BLS, is almost identical in each of the Februaries of 2010, 2011, and 2012!
Consider the 10-11 March 2012 issue of the Wall Street Journal: Jobs Recovery Gains Momentum blares the headline. The sub-headline was: U.S. Payrolls Climb 227,000 with Growth Across Industries; Unemployment Rate Holds at 8.3%. Now if this is a gain of momentum in jobs creation, how is it that the unemployment rate remained at 8.3%?
The answer, not given, might be that because more people found jobs, still more people entered the labor force, which is the sum of the employed and those actively looking for employment as seen by the government. Interestingly, one of graphs on the front page shows a small uptick in the labor force in February, but it is less than the down-tick in January was. What is more, the labor force plot is pretty much just downward in the second half of 2009 and all of 2010 and 2011. There had been an uptick in early 2010, but that is little more than noise on the major trendline. In fact, it was really just the effect of using seasonally adjusted data when the seasonal effect was somewhat out-of-whack because summer hiring was suppressed by a lack of construction jobs. Jobs creation momentum was falsely claimed then also. This WSJ significant graph of the labor force data is shown here:
So, I find myself totally puzzled about the Wall Street Journal evidence that we are seeing any jobs recovery, let alone one that is gaining momentum. The article does note that the economy has 5.2 million fewer jobs now than it had four years ago. It notes that the growing working age population ought to have many more jobs available than four years ago for the employed percentage to compare with the pre-Great Recession level. It observes that most economists say that "unemployment will remain elevated for years unless the pace of hiring accelerates." Indeed, it is just such acceleration that one would need to see to be able to say that the "Jobs Recovery Gains Momentum." Not only that, but one would need to see that acceleration apply to several months. Apparently fools write the headlines, which are all that most people see.
It seems that the economic or business reporters at the Wall Street Journal entrusted with the front page and the headlines just arbitrarily throw things into an article with no understanding of the Big Picture whatsoever. If the News Corporation, which owns Fox News, Fox News Business, and the Wall Street Journal cannot do better than this, it is no wonder the socialists are so often able to wrest control of our government. Even the opposition appears to have no economic judgment of note. It fails to point to the politically and economically crucial facts, so that our economically and business ignorant will become more knowledgeable. This response to the February jobs numbers out of the Bureau of Labor Statistics on the oppositions part is characteristic of their frequent failure to point out the significance of the data to the general public. It is terribly disappointing. If the voter is dumbed down, how will we ever counter the trend to worse and worse central planning by government?
A far more rational evaluation of the jobs numbers, with some perspective on the history during this recession, is given in my earlier post entitled Sick Economy has More Missing Jobs than in February 2010! The number of missing jobs, using the non-seasonally adjusted data of the BLS, is almost identical in each of the Februaries of 2010, 2011, and 2012!
11 March 2012
2012 Presidential Election Prediction
If Mitt Romney is chosen by the Republican Party as its candidate for the Presidency, I believe the election result will be something like this:
This gives the following electoral vote count:
Republican (Red), 315 electoral votes
Democrat (Blue), 178 electoral votes
Toss-up (Gray), 45 electoral votes
This seems an outlandish Republican win at this point, but my prediction is based on Romney winning almost all of the Republican voters that McCain won, winning more votes from the upper middle class and the wealthy than McCain did, winning higher percentages of Jewish and youth votes. I believe Hispanics and African-American voters will turn out in slightly lower numbers for Obama as well and that Romney will win a slightly higher fraction of their votes than McCain. I expect Obama will win most of the toss-up states in gray in the end, but by squeakers.
This is not because Romney is a fantastic candidate. It is mostly because the economy is that bad and the claims that it is now recovering are so false that most Americans will figure that out before the election. Romney will not make the mistake of elevating social conservative issues over the economic issues, as Santorum would, and as a result he will overcome the coolness factor of the wrongheaded Obama.
It is the economy, stupid!
I am putting this out there in part as a means to track how my own expectations change as this election cycle moves on. Of course this could prove embarrassing, but taking a chance on being wrong is often a useful way to learn. So this is my baseline prediction. It will be interesting to see how this evolves.
This gives the following electoral vote count:
Republican (Red), 315 electoral votes
Democrat (Blue), 178 electoral votes
Toss-up (Gray), 45 electoral votes
This seems an outlandish Republican win at this point, but my prediction is based on Romney winning almost all of the Republican voters that McCain won, winning more votes from the upper middle class and the wealthy than McCain did, winning higher percentages of Jewish and youth votes. I believe Hispanics and African-American voters will turn out in slightly lower numbers for Obama as well and that Romney will win a slightly higher fraction of their votes than McCain. I expect Obama will win most of the toss-up states in gray in the end, but by squeakers.
This is not because Romney is a fantastic candidate. It is mostly because the economy is that bad and the claims that it is now recovering are so false that most Americans will figure that out before the election. Romney will not make the mistake of elevating social conservative issues over the economic issues, as Santorum would, and as a result he will overcome the coolness factor of the wrongheaded Obama.
It is the economy, stupid!
I am putting this out there in part as a means to track how my own expectations change as this election cycle moves on. Of course this could prove embarrassing, but taking a chance on being wrong is often a useful way to learn. So this is my baseline prediction. It will be interesting to see how this evolves.
10 March 2012
Sick Economy has More Missing Jobs than in February 2010!
The U.S. economy remains unable to provide the missing jobs that have plagued it since the start of the Great Recession which really began in the first quarter of 2008 with real per capita GDP started shrinking from its high at the end of 2007. Actual negative GDP growth started in early 2009. The number of missing jobs reached a peak in January 2010, but then that number reduced a bit, but started increasing again and reached another local maximum in January 2011. This tends to be the annual cycle, using the household survey numbers without seasonal adjustment as I do. The February 2012 employment numbers were just reported by the Bureau of Labor Statistics on Friday and they simply track the annual pattern of the last two years, with no sign of a recovery from the recession. A chart of the number of missing jobs is shown below:
If you compare the number of missing jobs in February for 2010, 2011, and 2012 one finds that the number has hardly changed at all:
February 2010, missing jobs = 22,747,000
February 2011, missing jobs = 23,108,000
February 2012, missing jobs = 22,935,000
But to be more precise, there are slightly more missing jobs in February 2012 than there were two years earlier in 2010 and slightly fewer missing jobs than in February 2011. There is no sign of progress in putting the many people back to work who have lost jobs in this Great Recession. The February employment numbers have improved over those of January, but they have done that each of the last two years also and by about the same amount.
For those who have not been following my monthly analysis of the unemployment numbers, I calculate the number of jobs wanted based on the percentage of the non-institutional civilian working age population who wanted jobs in January 2000, which was actually already slightly lower than it was two to three years earlier than that. I subtract the number of employed people from the number of needed jobs and get the number of missing jobs. The calculations and numbers used are provided in the table below:
The real unemployment rate is 14.0%, which is slightly down from the real unemployment rate of January, as is usually true of February unemployment. The unemployment will fall into the summer and then start growing again until it will probably reach a maximum again in January 2013. This cycle is why only the seasonally adjusted unemployment numbers are usually discussed. However, the seasonal corrections made assume that the summer months will see a normal increase in outside jobs, such as construction jobs. But with the housing market so long depressed and there being no real prospect that housing and commercial construction will be at normal rates this coming summer, there is no real justification in making a normal winter size correction to the January and February employment numbers. In general, recessions will not behave in accordance with normal seasonal corrections and this is even more likely to be a problem in such a uniquely long recession.
As I have explained many times, this recession is one in which government policy has been very effective in prolonging the recession. The incredible level of uncertainty that Obama and his Democrat fiends have produced has very effectively suppressed gross private domestic investment to unheard levels and held that investment down for a very prolonged period. Without that investment there will be no significant job creation. Jobs lost in the early part of the recession in huge numbers cannot be recovered without much improved private investment. There is little likelihood of a significant improvement in business investment anytime this year, since Obama and the Democrats intend to stick to the wrongheaded policies that have deepened and prolonged this recession. If many of the 23 million Americans without jobs are to have them before too long, Obama and the Democrat-controlled Senate, which cannot produce a budget even, must be replaced. Throw these rascals out so millions of decent Americans can earn a living once again!
If you compare the number of missing jobs in February for 2010, 2011, and 2012 one finds that the number has hardly changed at all:
February 2010, missing jobs = 22,747,000
February 2011, missing jobs = 23,108,000
February 2012, missing jobs = 22,935,000
But to be more precise, there are slightly more missing jobs in February 2012 than there were two years earlier in 2010 and slightly fewer missing jobs than in February 2011. There is no sign of progress in putting the many people back to work who have lost jobs in this Great Recession. The February employment numbers have improved over those of January, but they have done that each of the last two years also and by about the same amount.
For those who have not been following my monthly analysis of the unemployment numbers, I calculate the number of jobs wanted based on the percentage of the non-institutional civilian working age population who wanted jobs in January 2000, which was actually already slightly lower than it was two to three years earlier than that. I subtract the number of employed people from the number of needed jobs and get the number of missing jobs. The calculations and numbers used are provided in the table below:
The real unemployment rate is 14.0%, which is slightly down from the real unemployment rate of January, as is usually true of February unemployment. The unemployment will fall into the summer and then start growing again until it will probably reach a maximum again in January 2013. This cycle is why only the seasonally adjusted unemployment numbers are usually discussed. However, the seasonal corrections made assume that the summer months will see a normal increase in outside jobs, such as construction jobs. But with the housing market so long depressed and there being no real prospect that housing and commercial construction will be at normal rates this coming summer, there is no real justification in making a normal winter size correction to the January and February employment numbers. In general, recessions will not behave in accordance with normal seasonal corrections and this is even more likely to be a problem in such a uniquely long recession.
As I have explained many times, this recession is one in which government policy has been very effective in prolonging the recession. The incredible level of uncertainty that Obama and his Democrat fiends have produced has very effectively suppressed gross private domestic investment to unheard levels and held that investment down for a very prolonged period. Without that investment there will be no significant job creation. Jobs lost in the early part of the recession in huge numbers cannot be recovered without much improved private investment. There is little likelihood of a significant improvement in business investment anytime this year, since Obama and the Democrats intend to stick to the wrongheaded policies that have deepened and prolonged this recession. If many of the 23 million Americans without jobs are to have them before too long, Obama and the Democrat-controlled Senate, which cannot produce a budget even, must be replaced. Throw these rascals out so millions of decent Americans can earn a living once again!
08 March 2012
A Paul Krugman Misdirection, John Galt Defamed
I do not often mention Paul Krugman, whose mind must be highly compartmentalized if there was any justification for his winning a Nobel Prize in Economics. In a 6 March 2012 commentary called John Galt Wants Price Support, he defamed my friend John Galt in a doubly underhanded way. The first instance is a failure to judge the character of New York financial businessmen objectively and honestly. The second was to use a limited time-history of economic data to misdirect his readers attention from the Big Picture of our economy and the effects on it that have caused this very extended recession. He performs an act of shear dishonesty for a very partisan, non-defensible socialist viewpoint. Let us examine his argument.
Krugman refers briefly to a Bloomberg article by Max Abelson about how Wall Street financial people are suffering lower income and having to cut back on their spending. One of the problems faced by many of the Wall Streeters were their concerns about being able to keep their children in private schools. Given the state of the city public schools, this is a concern to be taken seriously. Second homes, expensive cars, expensive pets, and many things most people view as luxuries were concerns. He then cites one Mike Konczal who claims that the interviewed Wall Streeters are whiners. Konczal says they are "rentiers, angry that their wealth isn't yielding the return they want." Konczal complains that these Wall Streeters have no business complaining about the Federal Reserve keeping interest rates incredibly low for years. For some time, the bank lending interest rate has been set at zero and we are told it will continue at this rate into 2014. Krugman then opines that these John Galts of Wall Street want interest rate price supports.
I do not doubt that numerous Wall Street financial people would be very happy with interest rate price supports. New York City is a Democrat stronghold. I am also sure that many would see the danger and would reject the idea. But Krugman here is doing the equivalent of lumping all of the businessmen in Atlas Shrugged together and observing that Orren Boyle and James Taggart want government price supports and announcing that therefor Hank Rearden and John Galt also want price supports. This obviously is an argument that would not fly with anyone who has read Ayn Rand's Atlas Shrugged, but it is made in order to keep people from reading Atlas Shrugged and to denigrate all of its many enthusiasts. For the sake of anyone who has not read Atlas Shrugged: Orren Boyle and James Taggart are villains who constantly advocate business-government partnerships that restrict free trade, while Hank Rearden and John Galt are heroes of a very moral character who believe in a very limited government and a robust private sector with little government interference.
Now let us examine Krugman's odd use of the economic data he presents. This is the chart he provides as justification for saying that an incipient excess supply of savings is the cause of the low return on the savings of the Wall Street financiers, where GPDI is Gross Private Domestic Investment and GPSAVE is Gross Private Saving:
The time periods marked are those in which the US GDP contracted, so they are the last two recessions by that definition. As I have noted, a better measure of the period of a recession is the period of time in which the real per capita GDP is in a lowered state. By that criterion we are still in this recession. Now Krugman has us looking at this savings and investment data over the last few years in which we see the gross private domestic investment exceed the gross private saving for a few years and then dip down well below it as the recession took effect. Once well into the recession, many more savings dollars are available to be used in investments to make money than are being so used. As a result, returns are low. He calls this a problem of excess savings and because he is a Nobel Prize winning economist, many accept his authority.
Let us examine the data over a longer time-frame:
Examining these charts, we see that both have long-term increasing curves with larger variations in the investment curve than in the saving curve. The Federal Reserve monitors the gross private savings and it plays a major role in the Federal Reserve effort to keep the money supply increasing at a steady and controlled rate. The gross private domestic investments will be a result of the gross private savings and the judgment of businessmen on the risk of investment. The risk of investment is heavily affected by actions of the federal government such as new laws (ObamaCare, Dodd-Frank Too Big To Fail, increased minimum wage), new or changed regulations (FDA, EPA, FDIC), and new or threatened taxes (taxes on medical devices, drugs, and clinical tests under ObamaCare, financial fees under Dodd-Frank, increased oil and gas royalties, threats of new taxes on wealthy and oil companies).
Krugman made it much harder for his readers to observe that it is usually the investments which are problematic. He also hid the fact that one of the most distinguishing marks of this Great Recession is that it has had a much, much bigger effect on reducing investment than any of the other recession periods since WWII! Why did he hide this? Because Krugman is a hack propagandist for big, socialist government and he does not want his readers to see how disastrous the federal government's policies have been in creating business uncertainty and a situation in which businesses can no longer see a way to make a profit in all too many potential investments they may evaluate. Krugman is hiding the fact that this recession, as with others, requires a renewal of private domestic investment if there is to be a recovery. Looking at the chart, the investment decrease from its bottom has recovered to only about 60% of the pre-recession level. This discounts the fact that over a normal four-year period the level of investments would rise quite a bit. Indeed, it needs to increase by about 4% just to keep up with population growth.
Krugman also claims that the Federal Reserve has done savers a favor by setting the bank lending rate at zero. He seems to imply that it might set it at some negative rate. In any case, a zero rate may help a segment of the financial market, but it hurts many others in that market. Over a period of time, it also tends to generate investment bubbles that then become a great danger for many investors and lenders.
Lowered gross private domestic investment causes a slow rate of GDP growth or worse. This contributes mightily to the real per capita GDP failure to recover from the recession. When a Nobel Prize winning economist tells you the problem is excess savings, Krugman is lying as badly as he was when he told us that Orren Boyle is really John Galt. This man and the publications, such as the New York Times, that carry his column are not worthy of being taken seriously.
Krugman refers briefly to a Bloomberg article by Max Abelson about how Wall Street financial people are suffering lower income and having to cut back on their spending. One of the problems faced by many of the Wall Streeters were their concerns about being able to keep their children in private schools. Given the state of the city public schools, this is a concern to be taken seriously. Second homes, expensive cars, expensive pets, and many things most people view as luxuries were concerns. He then cites one Mike Konczal who claims that the interviewed Wall Streeters are whiners. Konczal says they are "rentiers, angry that their wealth isn't yielding the return they want." Konczal complains that these Wall Streeters have no business complaining about the Federal Reserve keeping interest rates incredibly low for years. For some time, the bank lending interest rate has been set at zero and we are told it will continue at this rate into 2014. Krugman then opines that these John Galts of Wall Street want interest rate price supports.
I do not doubt that numerous Wall Street financial people would be very happy with interest rate price supports. New York City is a Democrat stronghold. I am also sure that many would see the danger and would reject the idea. But Krugman here is doing the equivalent of lumping all of the businessmen in Atlas Shrugged together and observing that Orren Boyle and James Taggart want government price supports and announcing that therefor Hank Rearden and John Galt also want price supports. This obviously is an argument that would not fly with anyone who has read Ayn Rand's Atlas Shrugged, but it is made in order to keep people from reading Atlas Shrugged and to denigrate all of its many enthusiasts. For the sake of anyone who has not read Atlas Shrugged: Orren Boyle and James Taggart are villains who constantly advocate business-government partnerships that restrict free trade, while Hank Rearden and John Galt are heroes of a very moral character who believe in a very limited government and a robust private sector with little government interference.
Now let us examine Krugman's odd use of the economic data he presents. This is the chart he provides as justification for saying that an incipient excess supply of savings is the cause of the low return on the savings of the Wall Street financiers, where GPDI is Gross Private Domestic Investment and GPSAVE is Gross Private Saving:
The time periods marked are those in which the US GDP contracted, so they are the last two recessions by that definition. As I have noted, a better measure of the period of a recession is the period of time in which the real per capita GDP is in a lowered state. By that criterion we are still in this recession. Now Krugman has us looking at this savings and investment data over the last few years in which we see the gross private domestic investment exceed the gross private saving for a few years and then dip down well below it as the recession took effect. Once well into the recession, many more savings dollars are available to be used in investments to make money than are being so used. As a result, returns are low. He calls this a problem of excess savings and because he is a Nobel Prize winning economist, many accept his authority.
Let us examine the data over a longer time-frame:
Examining these charts, we see that both have long-term increasing curves with larger variations in the investment curve than in the saving curve. The Federal Reserve monitors the gross private savings and it plays a major role in the Federal Reserve effort to keep the money supply increasing at a steady and controlled rate. The gross private domestic investments will be a result of the gross private savings and the judgment of businessmen on the risk of investment. The risk of investment is heavily affected by actions of the federal government such as new laws (ObamaCare, Dodd-Frank Too Big To Fail, increased minimum wage), new or changed regulations (FDA, EPA, FDIC), and new or threatened taxes (taxes on medical devices, drugs, and clinical tests under ObamaCare, financial fees under Dodd-Frank, increased oil and gas royalties, threats of new taxes on wealthy and oil companies).
Krugman made it much harder for his readers to observe that it is usually the investments which are problematic. He also hid the fact that one of the most distinguishing marks of this Great Recession is that it has had a much, much bigger effect on reducing investment than any of the other recession periods since WWII! Why did he hide this? Because Krugman is a hack propagandist for big, socialist government and he does not want his readers to see how disastrous the federal government's policies have been in creating business uncertainty and a situation in which businesses can no longer see a way to make a profit in all too many potential investments they may evaluate. Krugman is hiding the fact that this recession, as with others, requires a renewal of private domestic investment if there is to be a recovery. Looking at the chart, the investment decrease from its bottom has recovered to only about 60% of the pre-recession level. This discounts the fact that over a normal four-year period the level of investments would rise quite a bit. Indeed, it needs to increase by about 4% just to keep up with population growth.
Krugman also claims that the Federal Reserve has done savers a favor by setting the bank lending rate at zero. He seems to imply that it might set it at some negative rate. In any case, a zero rate may help a segment of the financial market, but it hurts many others in that market. Over a period of time, it also tends to generate investment bubbles that then become a great danger for many investors and lenders.
Lowered gross private domestic investment causes a slow rate of GDP growth or worse. This contributes mightily to the real per capita GDP failure to recover from the recession. When a Nobel Prize winning economist tells you the problem is excess savings, Krugman is lying as badly as he was when he told us that Orren Boyle is really John Galt. This man and the publications, such as the New York Times, that carry his column are not worthy of being taken seriously.
07 March 2012
Leftist Calls for Blue States to Go Galt on Red States
Long ago I realized the irony that the Blue States heavily subsidize most of the Red States with the money they pay in federal taxes. A Progressive Elitist, Sara Robinson, has somewhat cleverly used this to imply that the richer, more productive Blue States are being charitable to the mooching Blue States and they should Go Galt on the Blue States until the bigoted, backward people of the Red States are suitably grateful. Her article is entitled, Ayn Rand Worshippers Should Face Facts: Blue States Are the Providers, Red States Are the Parasites. Her argument is worthy of some thought, though she is way over the top in her VERY SUPERIOR condescension toward the people of the Red States. In that she is so childish and ill-informed that I will not bother to discuss her broad characterizations of the people of the Red States.
Her principal point is based upon a recent NY Times story that discussed this map of tax payments versus benefit payments on a state basis:
For the most part, the Red States do receive more in benefit payments than they pay in taxes and most of the Blue States pay more in taxes than they get back in benefits. Part of the reason for this is that population density is higher on the East and West Coasts and this has trade and commercial benefits of itself. The East Coast is the longest settled area and has had the easiest trade ties to a long wealthy Europe. The Southeast was destroyed by the Civil War and had been too rural and slave-dependent even before that. The Northeast first developed manufacturing on a major scale and the principal financial centers grew up there. The nation's capital is also on the East Coast. All of these factors helped to make the Northeast a wealthy area early on. The West Coast became much wealthier during the military build-up of WWII and then continued to have trade advantages with Asia thereafter. It definitely deserves praise for its development of many high technology businesses in the last several decades.
To address the issue of whether the Blue States really are more productive than the Red States, however, we should actually look at the Per Capita Income by State. In 2010, those numbers are well presented by the Tax Foundation here. By my reckoning, I identified 26 states as fairly reliable Red States and found that 10 of them were ranked among the top 25 states in per capita income. Four of the Red States are in the top 10 states by per capita income.
It also tends to be the case that the cost of living in Red States is lower than that in Blue States. Lower state and local taxes and fewer expensive state and local laws and regulations help to make a dollar go further. Some costs such as land costs go down simply because many of the Red States are less densely populated. Generally, housing costs are lower. The cost of doing business is often lower also. Meanwhile, Blue Staters are paying slightly higher tax rates on their federal income taxes because of the progressive tax rates. Their meaninglessly higher incomes suffer a larger fraction of tax loss due to the foolish idea of using fixed tax rates across the entire country. Correspondingly, many benefits are given out on the basis of income, so the lower apparent incomes of Red State people is more likely to induce a flow of federal money to them. These effects actually are not avoidable, but the problems can and should be minimized by minimizing the federal government.
The end result is that it is not entirely obvious that somewhat higher per capita income in the Blue States means that the people of the Blue States are actually more productive. It is not clear that money changing hands more rapidly actually means more productive work was done and more was actually accomplished. One can use a lot of energy spinning one's wheels, as is all too evident in many socialist countries. But, for the moment, let us allow that the Blue States may be slightly more productive, albeit maybe owing in good part to locational and historical advantages.
There is no question that the Blue States giving up more in taxes than they are getting back in benefits are draining their private sectors of wealth. Thus they are suffering a real handicap to business investment and are retarding their future GDP growth. The people of these states are lowering their standard of living.
It has long been assumed that states receiving more in federal benefit payments than they lose in taxes are benefiting from this extra federal income. This is false, as discussed in my previous post. I will patch the relevant part of that post in below for my reader's convenience:
Thus, what we find is that however charitable the motives of the Blue States may have been, their largesse to the Red States has a most malevolent effect! The Red States often have a better business environment relative to the state government, but that business advantage is often offset by the negative effect of having Senators and Representatives who are too good at bringing home the bacon. The Red States would be well-advised to make it clear to their Congressional representatives that they want them to vote against all spending increases by the federal government and that they want them to make every effort to cut back on present government spending. Contrary to the VERY SUPERIOR Progressive Elitist Sara Robinson's call for the Blue States to GO GALT until the Red States cry Uncle, both the Red States and the Blue States would be very well served if the Blue States were to GO GALT!
I do not actually believe the Blue States were that charitable in intent. Too many people there (here for me) really do want to live under socialist government. The cost to them of doing that is to bribe the people of the Red States who do tend to want more freedom with government handouts aimed at getting their politicians to go along with them. The Red States especially have a bit of a political advantage in the Senate due to their states having smaller populations on average.
This is why the Blue States pursue the growth of more government very vigorously and the Red States complain a bit, but are generally willing to go along at a preferred slower pace. For instance, the road infrastructure funding bill before Congress now is receiving the votes of almost all of the Democrat and Republican Senators. Only 11 are lined up against it. Seven of them are Republicans and four are Democrats up for re-election from states that are basically Red States. It is long overdue that the people of both the Red and Blue states understand that these money transfers across the country are only hurting themselves, without any beneficial effect at all. We badly need more federalism, with much less government from the national level. Then the Red States will prosper much more and the Blue States will at least suffer a little less. By all means, let us have all of the states Going Galt.
Her principal point is based upon a recent NY Times story that discussed this map of tax payments versus benefit payments on a state basis:
For the most part, the Red States do receive more in benefit payments than they pay in taxes and most of the Blue States pay more in taxes than they get back in benefits. Part of the reason for this is that population density is higher on the East and West Coasts and this has trade and commercial benefits of itself. The East Coast is the longest settled area and has had the easiest trade ties to a long wealthy Europe. The Southeast was destroyed by the Civil War and had been too rural and slave-dependent even before that. The Northeast first developed manufacturing on a major scale and the principal financial centers grew up there. The nation's capital is also on the East Coast. All of these factors helped to make the Northeast a wealthy area early on. The West Coast became much wealthier during the military build-up of WWII and then continued to have trade advantages with Asia thereafter. It definitely deserves praise for its development of many high technology businesses in the last several decades.
To address the issue of whether the Blue States really are more productive than the Red States, however, we should actually look at the Per Capita Income by State. In 2010, those numbers are well presented by the Tax Foundation here. By my reckoning, I identified 26 states as fairly reliable Red States and found that 10 of them were ranked among the top 25 states in per capita income. Four of the Red States are in the top 10 states by per capita income.
It also tends to be the case that the cost of living in Red States is lower than that in Blue States. Lower state and local taxes and fewer expensive state and local laws and regulations help to make a dollar go further. Some costs such as land costs go down simply because many of the Red States are less densely populated. Generally, housing costs are lower. The cost of doing business is often lower also. Meanwhile, Blue Staters are paying slightly higher tax rates on their federal income taxes because of the progressive tax rates. Their meaninglessly higher incomes suffer a larger fraction of tax loss due to the foolish idea of using fixed tax rates across the entire country. Correspondingly, many benefits are given out on the basis of income, so the lower apparent incomes of Red State people is more likely to induce a flow of federal money to them. These effects actually are not avoidable, but the problems can and should be minimized by minimizing the federal government.
The end result is that it is not entirely obvious that somewhat higher per capita income in the Blue States means that the people of the Blue States are actually more productive. It is not clear that money changing hands more rapidly actually means more productive work was done and more was actually accomplished. One can use a lot of energy spinning one's wheels, as is all too evident in many socialist countries. But, for the moment, let us allow that the Blue States may be slightly more productive, albeit maybe owing in good part to locational and historical advantages.
There is no question that the Blue States giving up more in taxes than they are getting back in benefits are draining their private sectors of wealth. Thus they are suffering a real handicap to business investment and are retarding their future GDP growth. The people of these states are lowering their standard of living.
It has long been assumed that states receiving more in federal benefit payments than they lose in taxes are benefiting from this extra federal income. This is false, as discussed in my previous post. I will patch the relevant part of that post in below for my reader's convenience:
More specifically, Harvard Business School professors have published a
study of the effects on a state when a Senator or a Representative is
moved up to being the Chairman of an important committee for
appropriations. The study, Do Powerful Politicians Cause Corporate Downsizing?,
covers a 42-year period and found that these committee chairman were
able to deliver large sums of earmarked or other money to their home
states. In the year following the ascendancy to a chairmanship for the
232 instances studied, the state had a 40 - 50% increase in federal
earmark spending, a 9-10% increase in total state government transfers,
and a 24% increase in total government contracts. The professors,
Lauren Cohen, Joshua Coval, and Christopher Malloy, expected businesses
in the state to benefit from the pumped up economy, consistent with what
most Keynesians would expect. Boy, was that ever wrong!
Instead, they found support for simple neo-classical model in which individuals trade work for more leisure when faced with government spending.
Increased resources from the government that are not expected to be funded by taxes or borrowing induce individuals to increase their consumption and leisure. The resulting decline in the marginal productivity of capital compels companies to scale back investment and output.
Focusing on the investment (capital expenditure), employment, R&D, and payout decisions of these firms, we find strong and widespread evidence of corporate retrenchment in response to government spending shocks. In the year that follows a congressman’s ascendency, the average firm in his state cuts back capital expenditures by roughly 15%. These firms also significantly reduce R&D expenditures and increase payouts to their investors. The magnitude of this private sector response is nontrivial: in the median state (which receives roughly $452 million per year in increased earmarks, federal transfers, and government contracts as a result of a seniority shock), capex and R&D reductions total $48 million and $44 million per year, respectively, while payout increases total $27 million per year. These changes in firm behavior persist throughout the chairmanship and begin to reverse after the congressman relinquishes the chairmanship. We also find some evidence that firms scale back their employment, and experience a decline in sales growth in response to the government spending shock.There is every reason to believe that such general effects upon companies will have similar effects upon the green energy companies. Joshua Coval says that these negative results applied to the average firm, large and small firms, and within the industries that are the target of the spending. Some of the government money hires employees away from other firms. He also believes that this money contributes to added uncertainty due to government involvement. He says the results indicate that government spending does not stimulate private economic development.
Thus, what we find is that however charitable the motives of the Blue States may have been, their largesse to the Red States has a most malevolent effect! The Red States often have a better business environment relative to the state government, but that business advantage is often offset by the negative effect of having Senators and Representatives who are too good at bringing home the bacon. The Red States would be well-advised to make it clear to their Congressional representatives that they want them to vote against all spending increases by the federal government and that they want them to make every effort to cut back on present government spending. Contrary to the VERY SUPERIOR Progressive Elitist Sara Robinson's call for the Blue States to GO GALT until the Red States cry Uncle, both the Red States and the Blue States would be very well served if the Blue States were to GO GALT!
I do not actually believe the Blue States were that charitable in intent. Too many people there (here for me) really do want to live under socialist government. The cost to them of doing that is to bribe the people of the Red States who do tend to want more freedom with government handouts aimed at getting their politicians to go along with them. The Red States especially have a bit of a political advantage in the Senate due to their states having smaller populations on average.
This is why the Blue States pursue the growth of more government very vigorously and the Red States complain a bit, but are generally willing to go along at a preferred slower pace. For instance, the road infrastructure funding bill before Congress now is receiving the votes of almost all of the Democrat and Republican Senators. Only 11 are lined up against it. Seven of them are Republicans and four are Democrats up for re-election from states that are basically Red States. It is long overdue that the people of both the Red and Blue states understand that these money transfers across the country are only hurting themselves, without any beneficial effect at all. We badly need more federalism, with much less government from the national level. Then the Red States will prosper much more and the Blue States will at least suffer a little less. By all means, let us have all of the states Going Galt.
Subscribe to:
Posts (Atom)